
The S&P 500 Index corrected nearly 20% from the September peak until December 24 before staging a furious rally of 19%. What could happen next? A well-deserved pullback would probably be perfectly normal, and in fact, is probably needed before another surge higher can occur. Now the $64,000 question: Would a pullback be a retest of the December lows, a 10% correction, or something more modest?
As we discussed in our recent Weekly Market Commentary: Modest Pullback Or Something Bigger? we think a pullback in the range of 3-5% is the most likely scenario. “We continue to see solid fundamentals, valuations that are quite reasonable, the strong possibility of a U.S.-China trade deal over the coming months, and healthy market technicals,” explained Senior Market Strategist Ryan Detrick. In fact, six technical indicators we mentioned in the recent
- The S&P 500 is above its upward sloping 50-day moving average (MA), suggesting an improving trend, and at support in the form of its 200-day moving average.
- March has been the second strongest month for the stock market over the past 20 years.
- Stocks tend to go up in the final 10 months o a year (25 out of the last 27 years) after experiencing gains during January and February.
- Market breadth is favorable, with a high proportion of stocks participating in this year’s advance.
- Investor flows have been negative in 2019—evidence of caution, not euphoria.
- Investor sentiment surveys suggest bulls are not in overabundance.
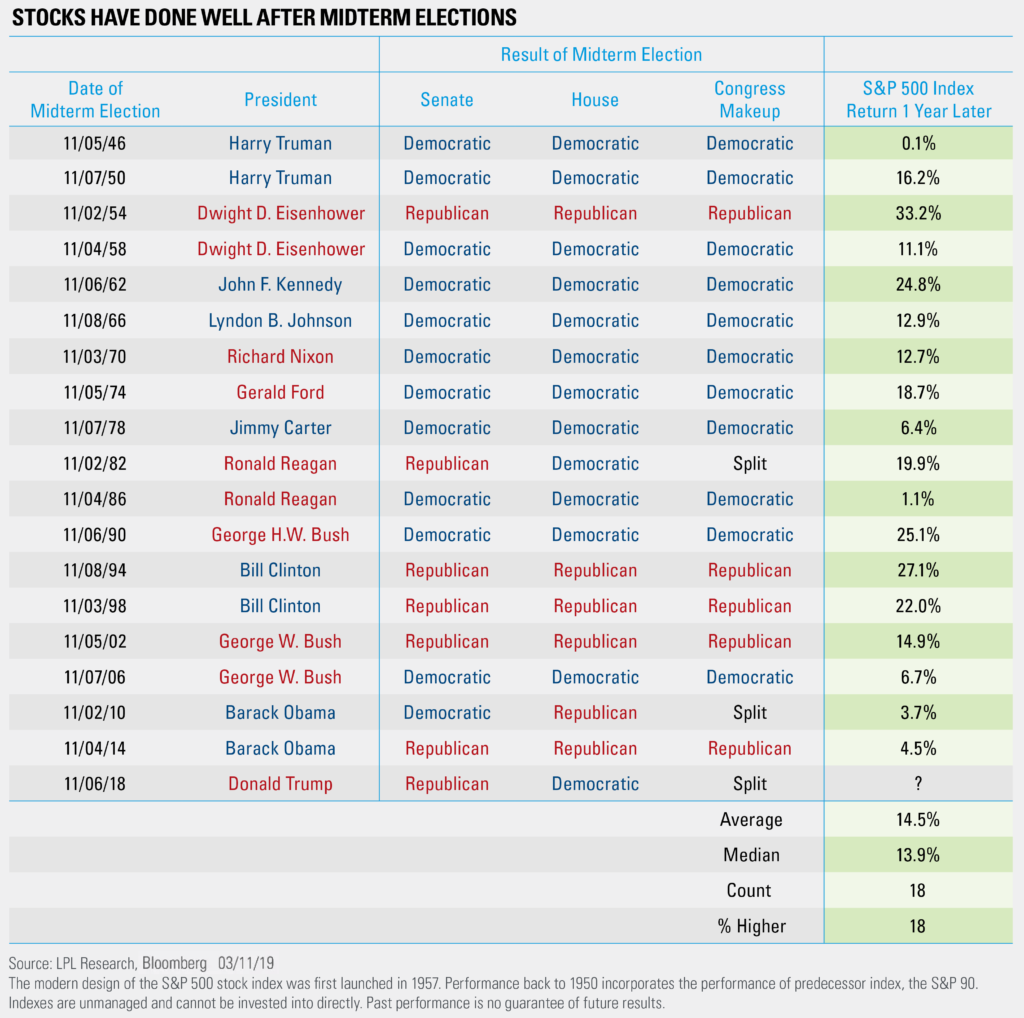
Last, as the LPL Chart of the Day shows, it’s important to remember that the S&P 500 has been higher a year after every midterm election since World War II—that’s 18 out of the 18 midterms—with an average return of 14.2%. President Trump views the stock market as part of his re-election path, suggesting this pattern could hold once again. With the S&P 500 up only 1.3% since the midterm election last November, there indeed could still be room for stocks to run in 2019.
IMPORTANT DISCLOSURES
The opinions voiced in this material are for general information only and are not intended to provide specific advice or recommendations for any individual security. To determine which investment(s) may be appropriate for you, consult your financial advisor prior to investing. The economic forecasts set forth in this material may not develop as predicted.
All indexes are unmanaged and cannot be invested into directly. Unmanaged index returns do not reflect fees, expenses, or sales charges. Index performance is not indicative of the performance of any investment. All performance referenced is historical and is no guarantee of future results.
Investing involves risks including possible loss of principal. No investment strategy or risk management technique can guarantee return or eliminate risk in all market environments.
This research material has been prepared by LPL Financial LLC.
To the extent you are receiving investment advice from a separately registered independent investment advisor, please note that LPL Financial LLC is not an affiliate of and makes no representation with respect to such entity.
The investment products sold through LPL Financial are not insured deposits and are not FDIC/NCUA insured. These products are not Bank/Credit Union obligations and are not endorsed, recommended or guaranteed by any Bank/Credit Union or any government agency. The value of the investment may fluctuate, the return on the investment is not guaranteed, and loss of principal is possible.
For Public Use | Tracking # 1-831604 (Exp. 03/20)