KEY TAKEAWAYS
- Four of the 10 bear markets since 1968 occurred without an accompanying recession, in 1976, 1987, 1998, and 2011.
- These bear markets can be placed into three categories: policy mistakes, financial crises, and excessive speculation.
- Given the possibility of an impending bear market (perhaps as much as a 30% probability), we would encourage investors, where appropriate, to consider maintaining slightly above average cash levels for dry powder should the recent selloff worsen.
Click here to download a PDF of this report.
Bear markets can occur without recessions. There have been ten bear markets in the S&P 500 since 1968, and four of them occurred without an accompanying recession. Bear markets are commonly defined as 20% peak-totrough declines based on closing prices, though we include two 19% drawdowns in this analysis, with one of them (1998) getting well past the 20% mark on an intra-day price basis (1976 is the other). Here we look at the characteristics of these non-recessionary bear markets to assess the probability that stocks enter a bear market even if the U.S. avoids recession in 2016.
NON-RECESSIONARY BEAR MARKETS
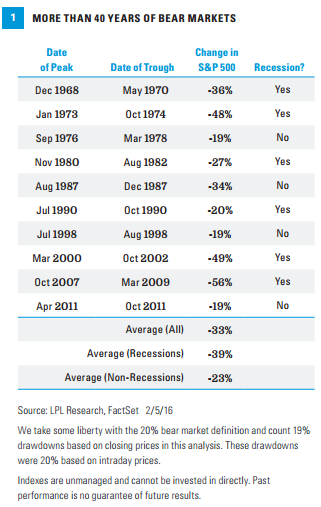
Bear markets can occur without recessions. Going back to 1968, ten bear markets have occurred with six accompanied by recessions [Figure 1]. The accompanying figure shows just how much more painful bear markets are when they are tied to recessions. In the six recessionary bear markets since 1968, the average peak-to-trough S&P 500 decline was a whopping 39%. The thought of such a decline when compared to where we are now, 11.6% below the May 21, 2015 record high, could make your stomach churn. (In the February 1, 2016, Weekly Economic Commentary, John Canally spelled out reasons why we do not expect a repeat of 2008, which would remove one big negative possibility from
the equation).
Based on our assessment of the economic data, we see the odds of a recession in the next year as still low (perhaps as high now as 30%), although certainly some indicators suggest an even higher probability. The risk remains that a policy mistake, such as an overly aggressive Federal Reserve (Fed), as in the mid-1970s, financial crisis (such as 1998 or 2011), or excessive speculation (a la 1987) drives the S&P 500 down another 8-9% to the 20% threshold. That is not our base case at this point but we do suggest a slightly more cautious approach toward equity markets as these odds have increased. The average S&P 500 loss in a non-recessionary bear market has been 23%; still more than 10% below Friday’s closing level.
NON-RECESSIONARY BEAR THEMES
Taking a closer look at the non-recessionary bear markets of 1976, 1987, 1998, and 2011, we place the market declines into three categories:
- Policy mistake. Fed tightening played a role in the 1976 bear market, which was accompanied by rising oil prices. The Fed raised the federal funds rate by 2 percent in 1977, the 10-year yield jumped 100 basis points, and oil prices started on a path to doubling in just two years.
The 1998 bear market was partly brought on by policy mistakes in Asia regarding managing their currencies, and was exacerbated by a lack of regulatory oversight into Long Term Capital Management (LTCM) that led to its becoming a systemic risk and eventual failure. (LTCM was a very large unregulated investment management firm with significant leverage that led to a multibillion dollar bailout after more than $4 billion in losses.) The Fed’s 25 basis point (0.25%) hike in the federal funds rate in March of 1997 did not help, but the selloff didn’t start until July of 1998 and the Fed’s three rate cuts in late 1998 helped end the crisis.
- Financial crisis. In 1998, a Russian default and collapse of LTCM got most of the headlines, but the Asian currency crisis that started in Thailand spread to other Southeast Asian countries (Malaysia, Indonesia, and the Philippines) and eventually into South America.
In 2011, stocks struggled with two crises: the European debt crisis and the U.S. debt ceiling fight and related downgrade of the U.S. credit rating by Standard & Poor’s. The solvency of the European banking system was in question due to heavy exposure to bad debts from heavily indebted European sovereigns, e.g., Greece, Spain, Portugal, and Italy. At the same time, some were questioning the credibility of the U.S. as a borrower.
- Excessive speculation. The crash of 1987 involved excessive speculation. Stocks were up 33% year to date as of September 30, 1987, one of the strongest starts for the S&P 500 in any year in history (second only to 43% in 1933). Stock valuations were very high relative to bonds, with the S&P 500 earnings yield (inverse of the price-to-earnings ratio) of 5.7% well below the 10-year Treasury yield at 9.6% as of September 30, 1987. Only 2000 saw a bigger spread over the past 40 years. Too many big players in the market tried to hedge portfolios at the same time, exaggerating the slide. The situation was exacerbated when institutions that sold portfolio insurance propelled another wave of selling when those “insurance claims” were cashed in.
SO WHERE DO WE STAND TODAY?
The most important question for investors today is could we be entering a bear market and, if so, would one of these three potential catalysts cause it?
Policy mistake. The Fed is the most obvious potential policy mistake looming, although we do expect the central bank to pull back from its stated timetable of four rate hikes in 2016. It is tough to characterize a single quarter-point hike as a mistake no matter what the eventual outcome. But a series of hikes could end up as a policy mistake leading to a bear market if it precedes dislocations in global financial markets, tightening credit conditions, and another potential leg down in global growth and earnings.
Besides the Fed, a policy mistake out of Washington is possible, though unlikely, depending on how the presidential election in November plays out. Looking to overseas markets, though not our expectation, China could mismanage its economy and suffer a hard landing.
Odds: About 30%.
Financial crisis. China is a primary concern among those calling for a bear market or recession. A significant currency devaluation could potentially drive a financial crisis similar to the Asian currency crisis that preceded the 1998 bear market. We would place the odds of a China-driven currency crisis at well below 50% given: 1) most Asian currencies are no longer pegged to the U.S. dollar, as they were in the late 1990s, 2) Asian economies’ finances and trade flows are in much better shape today, and 3) China has the ability and willingness to prevent it.
Another possible scenario is a repeat of the European debt crisis of 2011-2012. European banks generally have less capital than U.S. banks and may be more vulnerable; although actions taken by the European Central Bank (ECB) and the weaker European countries since 2011 mitigate this risk. Balance sheets are in better shape today and sovereign risk is low. Another debt ceiling fight, which also contributed to the 2011 bear market, is simply not in the cards.
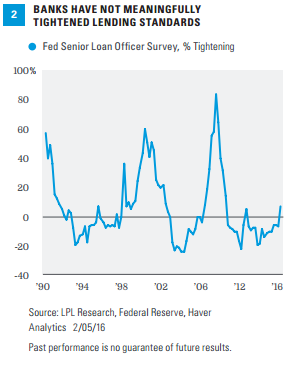
Also unlikely in our view is an oil-driven financial crisis. Energy company defaults could increase due to low oil prices, but we believe the markets are pricing in more defaults than will actually be realized. Also consider those defaults would put downward pressure on oil supplies and support prices. Finally, while credit spreads have widened even for non-energy companies, we have not seen credit availability restricted nearly enough to signal a financial crisis, as evidenced by the most recent Fed Senior Loan Officers Survey showing a still small, though gradually rising, number of banks tightening credit standards for business loans [Figure 2].
Odds: About 20%.
Excessive speculation. This potential bear market driver may be the easiest one to dismiss. Stock market valuations are reasonable at roughly 16 times trailing earnings. Factoring in interest rates, the S&P 500 is significantly cheaper than it was in 1987. The S&P 500 earnings yield stood 4% above the 10-year Treasury yield as of January 31, 2016, compared to September 30, 1987, just ahead of the October 1987 crash, when the earnings yield was about 4% below Treasury yields.
We do not see signs of excessive risk taking in the options markets and investor surveys such as that from the American Association of Individual Investors (AAII) indicate widespread pessimism see January 19, 2016, Weekly Market Commentary, “Any Bulls Left”. Strategies to hedge against stock declines have become increasingly popular as a result of that pessimism and market participants waiting for the next shoe to drop.
Finally, while the S&P 500 had risen more than 30% in nine months in September of 1987, the index has been virtually flat since May of 2014 and traded in one of its tightest ranges ever over a 21 month period, hardly indicative of any excesses.
Odds: Less than 10%.
CONCLUSION
Our forecast remains no recession in 2016 and an S&P 500 correction that stops short of a 20% bear market decline. But even in the absence of recession, history suggests that a bear market remains possible. Given the possibility that a policy mistake or financial crisis sends U.S. stocks into a bear market, perhaps with odds as high as 30%, we would encourage investors, where appropriate, to consider maintaining slightly above average cash levels for dry powder should the recent selloff worsen.
IMPORTANT DISCLOSURES
The opinions voiced in this material are for general information only and are not intended to provide specific advice or recommendations for any individual. To determine which investment(s) may be appropriate for you, consult your financial advisor prior to investing. All performance referenced is historical and is no guarantee of future results.
The economic forecasts set forth in the presentation may not develop as predicted and there can be no guarantee that strategies promoted will be successful.
Investing in stock includes numerous specific risks including: the fluctuation of dividend, loss of principal, and potential liquidity of the investment in a falling market.
Government bonds and Treasury bills are guaranteed by the US government as to the timely payment of principal and interest and, if held to maturity, offer a fixed rate of return and fixed principal value.
International investing involves special risks such as currency fluctuation and political instability and may not be suitable for all investors. These risks are often heightened for investments in emerging markets.
All investing involves risk including loss of principal.
The PE ratio (price-to-earnings ratio) is a measure of the price paid for a share relative to the annual net income or profit earned by the firm per share. It is a financial ratio used for valuation: a higher PE ratio means that investors are paying more for each unit of net income, so the stock is more expensive compared to one with lower PE ratio.
INDEX DESCRIPTIONS
The Standard & Poor’s 500 Index is a capitalization-weighted index of 500 stocks designed to measure performance of the broad domestic economy through changes in the aggregate market value of 500 stocks representing all major industries.
This research material has been prepared by LPL Financial LLC.
To the extent you are receiving investment advice from a separately registered independent investment advisor, please note that LPL Financial LLC is not an affiliate of and makes no representation with respect to such entity.
Not FDIC or NCUA/NCUSIF Insured | No Bank or Credit Union Guarantee | May Lose Value | Not Guaranteed by Any Government Agency | Not a Bank/Credit Union Deposit
Tracking #1-465992 (Exp. 02/17)