
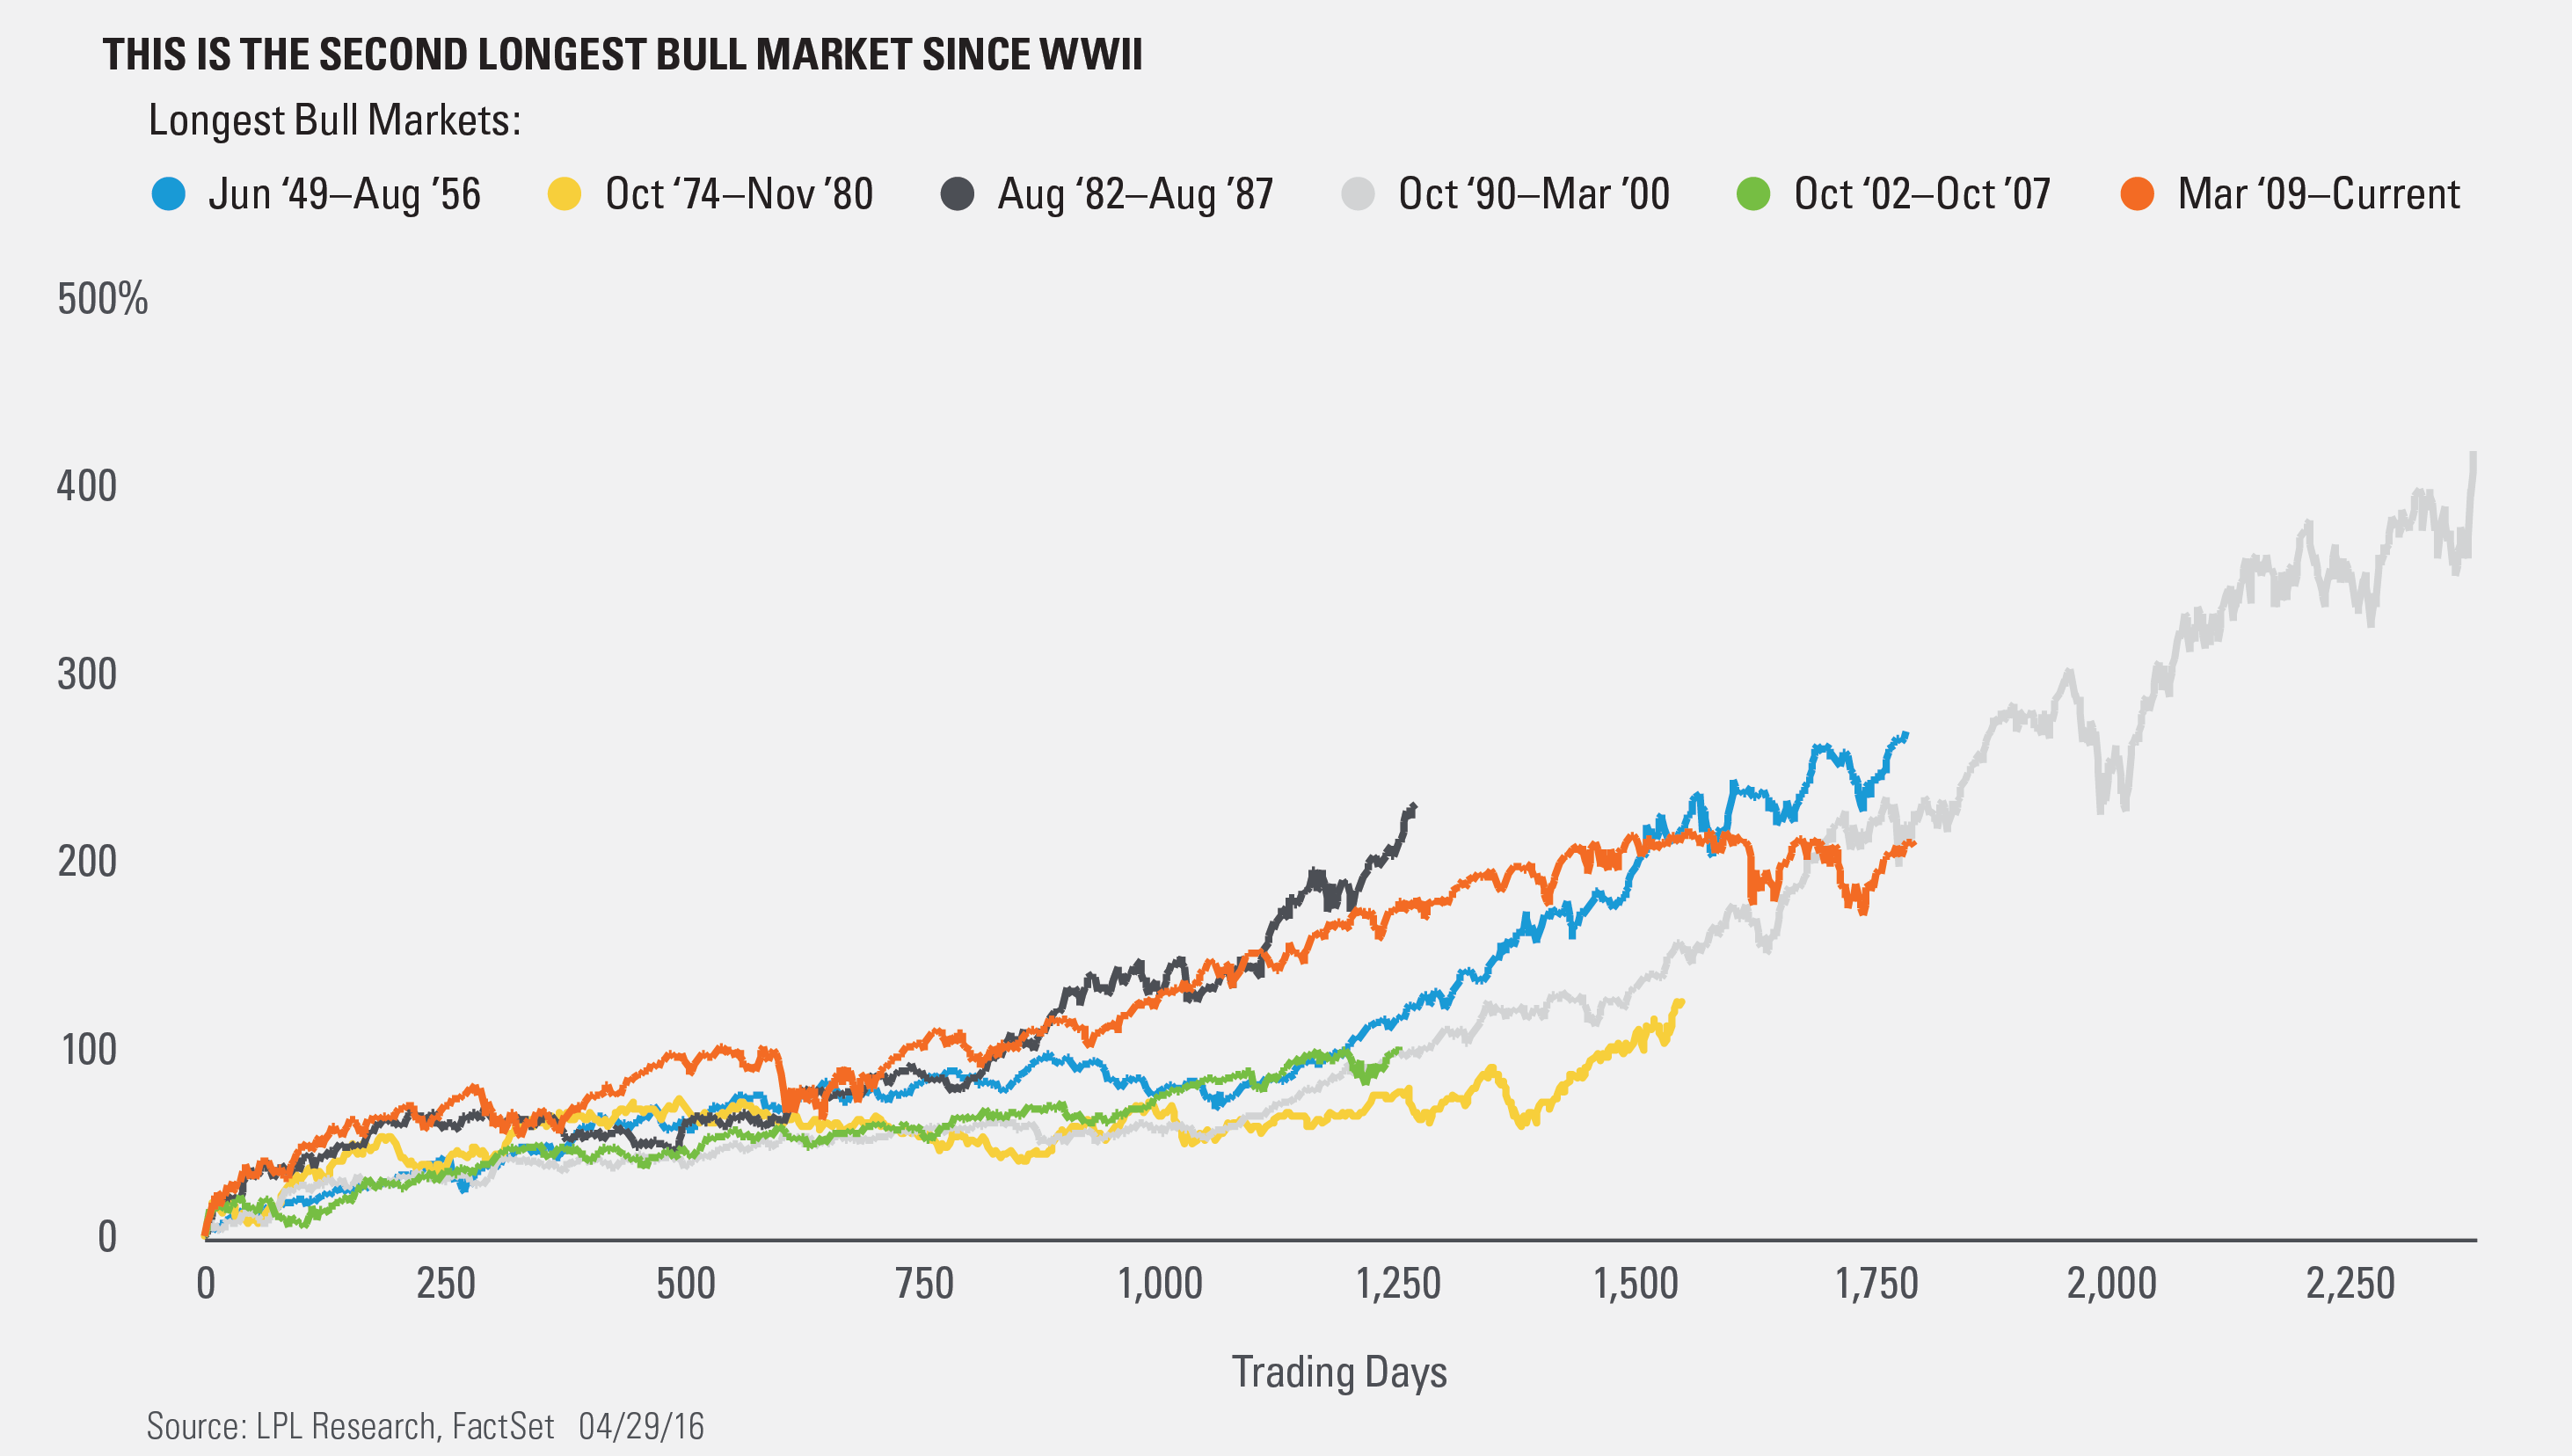
Earlier this week, the bull market turned more than 1,800 trading days old, making it officially the second-longest bull market since World War II. In calendar months, the current bull is now 87 months old and is longer than the bull market of 1949–1956, with only the bull market of the 1990s longer at 115 months.
The logical question that comes up, however, is did the bull market actually end? We won’t know this until well after the fact, but remember, the S&P 500 hasn’t made a new all-time high since May 21, 2015. Some have concluded that means the bull market has indeed ended, with such a long period between new highs. Our view is that the bull market is indeed still alive, as there have been other times in the middle of bull markets that have seen extended periods of consolidation before another eventual surge higher. The most recent example of this was in 1994, as that period was flat before a nice surge higher for the rest of the 1990s.
As our chief investment officer Burt White has noted many times, bull markets don’t die of old age, they die of excesses. This bull might be old, but currently, we simply aren’t seeing the level of excess (leverage, credit, speculation, bullish sentiment) that we’ve seen at other major market peaks.
Turning to today, the S&P is 3.5% away from a new all-time high. There is potential for strong improvement in earnings and the economy in the second half of the year, as dollar headwinds possibly turn into tailwinds. We continue to expect some volatility for the remainder of this year; but when 2016 is all said and done, we think mid-single-digit gains are possible.* This bull market might be old, but in our opinion, it isn’t over yet.
IMPORTANT DISCLOSURES
*Historically since WWII, the average annual gain on stocks has been 7-9%. Thus, our forecast is roughly in-line with average stock market growth. We forecast a mid-single digit gain, including dividends, for U.S. stocks in 2016 as measured by the S&P 500. This gain is derived from earnings per share (EPS) for S&P 500 companies assuming mid-to-high-single-digit earnings gains, and a largely stable price-to-earnings ratio. Earnings gains are supported by our expectation of improved global economic growth and stable profit margins in 2016.
Past performance is no guarantee of future results. All indexes are unmanaged and cannot be invested into directly.
Unmanaged index returns do not reflect fees, expenses, or sales charges. Index performance is not indicative of the performance of any investment.
The economic forecasts set forth in the presentation may not develop as predicted.
The opinions voiced in this material are for general information only and are not intended to provide or be construed as providing specific investment advice or recommendations for any individual security.
Stock investing involves risk including loss of principal.
The S&P 500 Index is a capitalization-weighted index of 500 stocks designed to measure performance of the broad domestic economy through changes in the aggregate market value of 500 stocks representing all major industries.
This research material has been prepared by LPL Financial LLC.
To the extent you are receiving investment advice from a separately registered independent investment advisor, please note that LPL Financial LLC is not an affiliate of and makes no representation with respect to such entity.
Not FDIC/NCUA Insured | Not Bank/Credit Union Guaranteed | May Lose Value | Not Guaranteed by any Government Agency | Not a Bank/Credit Union Deposit
Securities and Advisory services offered through LPL Financial LLC, a Registered Investment Advisor
Member FINRA/SIPC
Tracking # 1-494905 (Exp. 05/17)