
KEY TAKEAWAYS
- 2017 was a remarkable record-breaking year for stocks.
- 2018 is off to a very strong start, with stocks up all four trading days and the S&P 500 already 2.6% higher year to date.
- Given clarity on the new tax law, we summarize our equity views for 2018.
WILL A STRONG 2017 CARRY OVER INTO 2018?
We close the book on a solid 2017 for U.S. stocks while tipping our caps to a strong start to 2018. Today’s Weekly Market Commentary will provide a high-level performance recap for 2017 that we hope will be helpful for year-end client conversations, in addition to a summary of our equity market views for 2018 following passage of the new tax law.
A QUICK LOOK BACK AT 2017
2017 was truly a remarkable year for the U.S. stock market with record-breaking abound. The S&P 500 Index produced 12 positive monthly returns for the first year ever. The Dow Jones Industrials Average produced 71 record highs — its highest total ever. And the year proved to be one of the least volatile in the history of the VIX Index, with some of the lowest volatility readings ever and without so much as even a 3% pullback, despite significant geopolitical uncertainty worldwide.
The strong year for stocks was driven by several factors but we attribute the gains primarily to the following:
- Synchronized global economic expansion. U.S. economic growth picked up some speed as 2017 progressed, helping support gains in U.S. stocks. But equally as important was the breadth of growth globally. As 2017 ended, all Organization for Economic Co-operation and Development (OECD) countries had manufacturing Purchasing Managers’ Indexes over 50 and, impressively, more than 80% of them rose year over year in the latest reported month (November).
- Global earnings rebound. The S&P 500 is on track to produce a 10% increase in profits in 2017 based on current consensus estimates from Thomson and FactSet. Technology and emerging market equities were big beneficiaries of earnings-driven gains as each rallied nearly 40% and saw strong earnings increases.
- Passage of new tax law. Despite skeptics, President Trump and congressional Republicans delivered tax reform before Christmas. The anticipation, eventual passage, and expected boost to corporate profits from the tax bill all helped stocks cap off their strong year.
Monetary policy support. Inflation remained benign, enabling central banks around the world to maintain a very gradual pace of raising interest rates or tapering securities purchases. Most of the world’s leading central banks are only in the early stages of pulling back while the Bank of Japan is still going full speed.
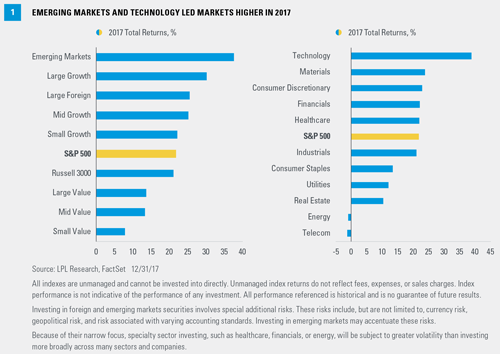
In terms of what worked, growth outperformed value (largely on technology strength), large caps outperformed small and mid despite greater relevant benefits of lower tax rates for small, and international equities, notably emerging markets, outperformed U.S. equities as the U.S. dollar weakened and global growth accelerated [Figure 1].
KEY DRIVERS FOR THE RETURN OF THE BUSINESS CYCLE
The return of the business cycle, as discussed in our Outlook 2018, remains our major theme for the year. With the Federal Reserve (Fed) pulling back on its monetary policy support, fiscal policy and earnings will emerge as key drivers. S&P 500 companies are well positioned with the potential to generate double-digit earnings growth thanks to a combination of better economic growth and lower corporate tax rates. In addition, the ability of businesses to fully expense (100%) capital expenditures over the next five years may provide a powerful tailwind for profits. Going forward, we look for business investment and further gains in earnings per share to power the economy and equity markets, respectively.
A focus on business fundamentals and the impact of fiscal policy could have implications for equity leadership in 2018:
- Size. Small cap stocks typically have endured a bigger tax burden than large caps, making them a big beneficiary of the new tax law generally. We also expect small caps to be a beneficiary of a stronger dollar in 2018 as the Fed gradually raises rates and shrinks its balance sheet. More domestic exposure means smaller companies do not typically experience currency translation challenges on their earnings that larger, multinational corporations confront.
- Style. The value style of investing may benefit from the new fiscal legislation. Value tends to perform better when economic growth accelerates, which we expect to see in 2018. Higher price-to-earnings ratios (PE) for growth may attract the attention of value seekers. Higher interest rates as growth and inflation pick up, and a potentially steeper yield curve may also support better value performance in traditional value plays such as financials.
- Sector. We expect cyclical sectors to outperform their defensive counterparts as the economic expansion continues with help from tax reform. Our favored sectors include financials, industrials, and technology. The financial sector may benefit from a lower corporate tax rate, a steeper yield curve, and deregulation efforts. Industrials may benefit from stronger global growth, lower taxes, 100% capital expensing, higher U.S. defense spending, and a possible infrastructure spending plan. Last, solid global demand and profits held overseas that can be repatriated at attractive rates may support technology sector outperformance in 2018.
2018 OFF TO A STRONG START
The year is off to a strong start with the S&P 500 up 2.6% already in just four trading days, the index’s best start since 2006. Data has helped, including a strong and much better than expected December reading on the U.S. Institute for Supply Management (ISM) Manufacturing Index, at 59.7, and some of the strongest European manufacturing survey readings ever recorded. December job growth did miss expectations in Friday’s employment report (148K versus 190K Bloomberg consensus), but the miss did not slow stocks down as the S&P 500 added 0.7% on Friday.
TAX LAW CLARITY DROVE RECENT UPGRADE TO FORECASTS
With recent clarity on the new tax law, we upgraded our forecasts for economic growth, earnings, and S&P 500 returns for 2018. In our Outlook 2018 we had forecast that the stock market’s PE multiple, at 19.5 times trailing earnings, would roughly hold steady.* Our then 8-10% S&P 500 earnings growth forecast for 2018 at that PE drove our prior 2018 year-end S&P 500 target of 2725-2750 and total return forecast of 8-10% (including dividends). (Based on expectations of better economic growth, with potential added benefit from lower corporate tax rates.)
The passage of the new tax law and its potential boost to corporate profitability led us to raise our 2018 S&P 500 earnings forecast from $142.50 to $147.50. Assuming a trailing 12-month PE of 19-20, we believe the S&P 500 would be fairly valued in the range of 2,850-2,900 by year-end 2018, or approximately 8% above closing levels on December 31, 2017. We appreciate that stock valuations are above historical averages, but we view them as fair given low-interest rates and inflation.
CONCLUSION
2017 was a great year for stocks and, so far, 2018 is off to an excellent start. For more on our key themes for 2018, please refer to our Outlook 2018: Return of the Business Cycle. And for more on the economic, earnings, and market impacts of the new tax law, please refer to our Investment Implications of the New Tax Law commentary.
*The PE (price-to-earnings) ratio is a measure of the price paid for a share relative to the annual net income or profit earned by the firm per share. It is a financial ratio used for valuation: a higher PE ratio means that investors are paying more for each unit of net income, so the stock is more expensive compared to one with a lower PE ratio.
IMPORTANT DISCLOSURES
Small cap is a term used to classify companies with a relatively small market capitalization. The definition of small cap can vary, but it is generally a company with a market capitalization of between $300 million and $2 billion. The prices of small-cap stocks are generally more volatile than large-cap stocks.
Because of its narrow focus, specialty sector investing, such as healthcare, financials, or energy, will be subject to greater volatility than investing more broadly across many sectors and companies.
The opinions voiced in this material are for general information only and are not intended to provide specific advice or recommendations for any individual. To determine which investment(s) may be appropriate for you, consult your financial advisor prior to investing. All performance referenced is historical and is no guarantee of future results.
The economic forecasts set forth in the presentation may not develop as predicted and there can be no guarantee that strategies promoted will be successful.
Investing in stock includes numerous specific risks including the fluctuation of dividend, loss of principal, and potential liquidity of the investment in a falling market.
Investing in foreign and emerging markets securities involves special additional risks. These risks include, but are not limited to, currency risk, political risk, and risk associated with varying accounting standards. Investing in emerging markets may accentuate these risks.
The fast price swings in commodities and currencies will result in significant volatility in an investor’s holdings.
Currency risk is a form of risk that arises from the change in the price of one currency against another. Whenever investors or companies have assets or business operations across national borders, they face currency risk if their positions are not hedged.
All investing involves risk including loss of principal.
DEFINITIONS
The VIX is a measure of the volatility implied in the prices of options contracts for the S&P 500. It is a market-based estimate of future volatility. When sentiment reaches one extreme or the other, the market typically reverses course. While this is not necessarily predictive, it does measure the current degree of fear present in the stock market.
Yield curve is a line that plots the interest rates, at a set point in time, of bonds having equal credit quality, but differing maturity dates. The most frequently reported yield curve compares the 3-month, 2-year, 5-year, and 30-year U.S. Treasury debt. This yield curve is used as a benchmark for other debt in the market, such as mortgage rates or bank lending rates. The curve is also used to predict changes in economic output and growth.
INDEX DESCRIPTIONS
The Standard & Poor’s 500 Index is a capitalization-weighted index of 500 stocks designed to measure the performance of the broad domestic economy through changes in the aggregate market value of 500 stocks representing all major industries.
The Institute for Supply Management (ISM) index is based on surveys of more than 300 manufacturing firms by the Institute of Supply Management. The ISM Manufacturing Index monitors employment, production inventories, new orders, and supplier deliveries. A composite diffusion index is created that monitors conditions in national manufacturing based on the data from these surveys.
Purchasing Managers Indexes (PMI) are economic indicators derived from monthly surveys of private sector companies and are intended to show the economic health of the manufacturing sector. A PMI of more than 50 indicates expansion in the manufacturing sector, a reading below 50 indicates contraction, and a reading of 50 indicates no change. The two principal producers of PMIs are Markit Group, which conducts PMIs for over 30 countries worldwide, and the Institute for Supply Management (ISM), which conducts PMIs for the United States.
Dow Jones Industrial Average is the most widely used indicator of the overall condition of the stock market, a price-weighted average of 30 actively traded blue chip stocks, primarily industrials. The 30 stocks are chosen by the editors of the Wall Street Journal. The Dow is computed using a price-weighted indexing system, rather than the more common market cap-weighted indexing system.
This research material has been prepared by LPL Financial LLC.
To the extent you are receiving investment advice from a separately registered independent investment advisor, please note that LPL Financial is not an affiliate of and makes no representation with respect to such entity.
Not FDIC or NCUA/NCUSIF Insured | No Bank or Credit Union Guarantee | May Lose Value | Not Guaranteed by Any Government Agency | Not a Bank/Credit Union Deposit
Tracking #1-684950 (Exp. 01/19)