
KEY TAKEAWAYS
- The new law is intended to boost economic activity and simplify the U.S. tax code.
- Given clarity on the new tax law, we are raising estimates for U.S. gross domestic product and S&P 500 operating earnings for 2018.
INVESTMENT IMPLICATIONS OF THE NEW TAX LAW: EQUITIES AT A GLANCE
After more than a year of political posturing and investor anticipation, Congress finally approved a $1.5 trillion tax cut, the most sweeping U.S. fiscal overhaul since 1986. The 2017 Tax Cuts and Jobs Act was signed into law by President Trump on December 22, 2017, meeting his pledge to deliver tax reform before Christmas. The complex 1,000-page bill features changes that are intended to spur economic activity through a reduction in both individual and corporate tax rates, and simplify the tax code by eliminating or trimming a variety of deductions and exemptions. In this week’s commentaries, we look at the likely impact of the final bill on the economy, monetary policy, and the financial markets in the coming years.
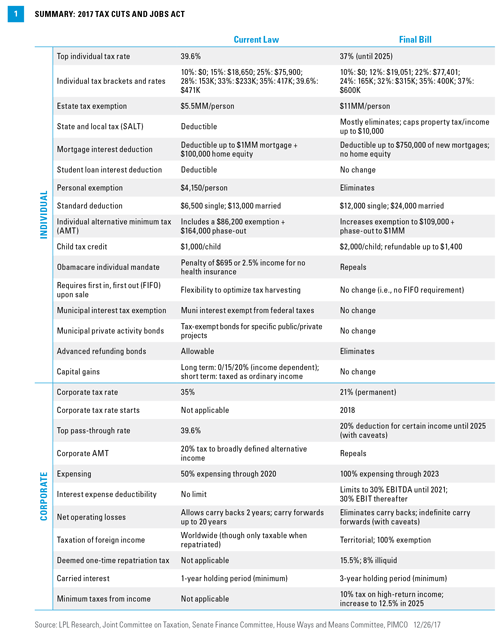
As we wrote in our Outlook 2018: Return of the Business Cycle publication, we believe the combination of improved business fundamentals and fiscal legislation should sustain momentum in the economy and equity markets in the coming year and potentially beyond. After years of depending on the largess of monetary policymakers, investors can now focus on fiscal levers that we believe will support consumption and spur new business investment over the next few years. The law has important implications for major corporations, small businesses, and individual taxpayers [Figure 1], and may shift the trajectory for economic growth, the federal budget, monetary policy, and perhaps most critically for investors — corporate profits.
EQUITIES
As we wrote in our Outlook 2018, corporate profitability will likely be a significant beneficiary of any meaningful change in the corporate tax rate. Indeed, the reduction of the corporate tax rate from 35% to 21%, combined with businesses’ ability to fully expense their capital expenditures for the next five years, are powerful potential tailwinds for profits, which have already enjoyed a renaissance in 2017, powered by improved domestic and global demand. We believe this will help elongate the expansion, which has thus far been powered by the U.S. consumer. Going forward, we look for business investment and further gains in corporate earnings per share (EPS) to power the economy and equity markets.
Given the potential for an extended expansion due to the new tax changes, we encourage all diversified investors to remain diligent relative to their targeted allocations. To be sure, 2017 was a year of extremely low volatility and the coming year may not be as docile, particularly when considering the historic examples of financial markets tending to test new Fed chairs, as well as the volatile trading patterns leading up to midterm elections. But given solid global growth and firming corporate profits, we recommend that any market pullbacks be considered as an opportunity to deploy cash or rebalance back toward targeted allocations.
Size, Style, and Sector Implications
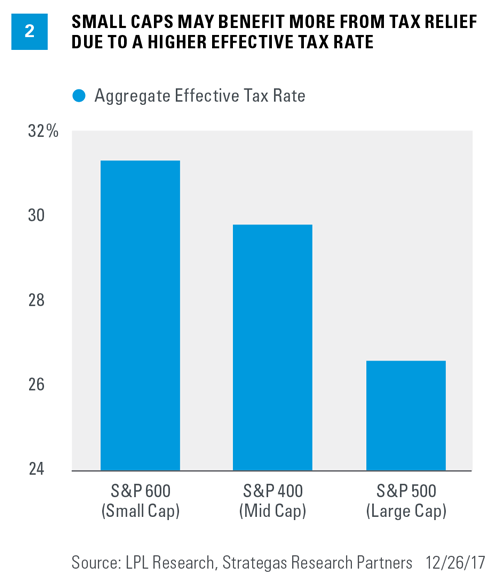
Entering the ninth year of this expansion, our view continues to favor small cap and cyclical exposure. Specifically, we prefer a slight overweight (relative to benchmarks) of small cap stocks and, despite the recent momentum supporting growth stocks, are positioning portfolios for a tilt toward the value style of investing. Small caps may benefit from the new law due to a typically higher tax burden relative to large caps [Figure 2]. Small caps would also be more likely to benefit should the dollar push higher due to the pickup in economic growth, since their more domestic focus makes them less vulnerable to the negative impact of a rising dollar on international profits.
We also believe the value style of investing should benefit from the new fiscal legislation. As investors search for opportunities, the recent gains in the price-to-earnings ratio (PE) for growth stocks should attract the attention of value seekers. The tax advantages combined with relative value should enable the value style to garner added attention, especially since many value names are in sectors that are poised to benefit from tax cuts, infrastructure spending, and reduced regulation.
The financial sector, typically exposed to higher tax rates, will be a primary beneficiary of the reduced corporate rate. In addition to fiscal policy changes, financial stocks may benefit from monetary policy in two separate ways. First, if economic growth lifts the yield on longer-dated Treasuries, it should help boost the spread between deposit and lending rates, known as net interest margin, which is a primary driver for bank profitability. Second, the new vice chair of supervision at the Fed, Randal Quarles, indicated a preference for less stringent regulatory burdens in his confirmation hearing, potentially freeing up more capital for lending in the coming years.
The industrial sector, which tilts toward the value style as well, may also benefit from a combination of lower taxes, infrastructure outlays, helped by 100% expensing, global growth, and increases in U.S. government defense spending.
Finally, the technology sector remains an overweight recommendation among growth-oriented sectors, despite its 2017 gains, given the combination of solid global demand and the large trove of profits held overseas that now have the opportunity for repatriation at attractive rates. Repatriated profits can then be used for either capital investment or shareholder friendly share buybacks or dividend payouts.
Raising Profits Forecasts
Considering the changes in the tax law and the likely boost to corporate profitability, we have decided to raise our Outlook 2018 operating earnings forecast for companies in the S&P 500 Index by $5.00 per share, from $142.50 to $147.50 in 2018. Assuming a trailing 12-month PE of 19-20, we believe the S&P 500 would be fairly valued in the range of 2,850-2,900 by year-end 2018. This represents a move of approximately 8.0% from current levels, not including dividends, as stocks have already begun to price in tax reform during the fourth quarter of 2017. We appreciate that this market PE remains above historical averages, but we view the market multiple relative to interest rate and inflation levels, which we expect to remain well below their typical norms over the course of the next year, likely boosting the amount the market is willing to pay for each additional dollar of earnings.
CONCLUSION
It’s been our view since the election that the combination of a Republican president with a Republican Congress had a high chance of passing some form of tax relief, whether it be in the form of tax cuts or more comprehensive tax reform. Early legislative setbacks led us to push back our timeline, but we remained confident that a tax bill would find its way to the president’s desk. While the accelerated legislative process that led to the president being able to sign the bill into law on December 22, 2017 was a surprise to us, it does not substantially change our views.
The biggest impact of the accelerated timeline is decreased uncertainty, allowing individuals and businesses the opportunity to begin planning around the changes and pulling forward the new law’s impact. As a result, we have upgraded our economic growth path to 2.75-3.0%, maintained our bond market view though we see greater risk to the upside for rates, and upgraded our S&P 500 target to align with our view of the law’s expected impact on corporate earnings. Our upgraded S&P 500 target keeps our broad return expectations for 2018 at approximately 10% including dividends. While the new law should help provide fiscal support for the economy as monetary support is withdrawn and helps decrease the chance of recession in 2018 and even in 2019, we still expect to see market volatility increase from the extraordinarily low levels that persisted in 2017. But nevertheless, for markets and the economy, we believe the new law provides a firmer launching point as we enter the new year.
Please see the Outlook 2018: Return of the Business Cycle publication for additional descriptions and disclosures.
IMPORTANT DISCLOSURES
The opinions voiced in this material are for general information only and are not intended to provide or be construed as providing specific investment advice or recommendations for any individual security. To determine which investments may be appropriate for you, consult your financial advisor prior to investing. All indexes are unmanaged and cannot be invested into directly. Unmanaged index returns do not reflect fees, expenses, or sales charges. Index performance is not indicative of the performance of any investment. All performance referenced is historical and is no guarantee of future results. Estimates may not develop as predicted.
All information is believed to be from reliable sources; however, we make no representation as to its completeness or accuracy.
The economic forecasts set forth in the presentation may not develop as predicted and there can be no guarantee that strategies promoted will be successful.
Investing in stock includes numerous specific risks including: the fluctuation of dividend, loss of principal, and potential liquidity of the investment in a falling market.
Because of its narrow focus, specialty sector investing, such as healthcare, financials, or energy, will be subject to greater volatility than investing more broadly across many sectors and companies.
The fast price swings in commodities and currencies will result in significant volatility in an investor’s holdings.
There is no guarantee that a diversified portfolio will enhance the overall returns or outperform a non-diversified portfolio. Diversification does not ensure against market risk.
All investing involves risk including loss of principal.
DEFINITIONS
Gross Domestic Product (GDP) is the monetary value of all the finished goods and services produced within a country’s borders in a specific time period, though GDP is usually calculated on an annual basis. It includes all of private and public consumption, government outlays, investments and exports less imports that occur within a defined territory.
Small cap is a term used to classify companies with a relatively small market capitalization. The definition of small cap can vary, but it is generally a company with a market capitalization of between $300 million and $2 billion. The prices of small cap stocks are generally more volatile than large cap stocks.
INDEX DESCRIPTIONS
The Standard & Poor’s 500 Index is a capitalization-weighted index of 500 stocks designed to measure performance of the broad domestic economy through changes in the aggregate market value of 500 stocks representing all major industries.
The S&P Midcap 400 Stock Index is an unmanaged index generally representative of the market for the stocks of mid-sized U.S. companies.
The S&P Small Cap 600 Index is an unmanaged index generally representative of the market for the stocks of small capitalization U.S. companies.
This research material has been prepared by LPL Financial LLC.
To the extent you are receiving investment advice from a separately registered independent investment advisor, please note that LPL Financial is not an affiliate of and makes no representation with respect to such entity.
Not FDIC or NCUA/NCUSIF Insured | No Bank or Credit Union Guarantee | May Lose Value | Not Guaranteed by Any Government Agency | Not a Bank/Credit Union Deposit
Tracking #1-682608 (Exp. 01/19)