
KEY TAKEAWAYS
- We have raised our 2018 S&P 500 EPS forecast from $147.50 to $152.50 and our S&P 500 year-end fair value target to 2950-3000.
- Guidance has been very strong on the back of the new tax law, better growth, and a weak U.S. dollar.
- Fourth quarter earnings season produced the best earnings and revenue growth in six years.
RAISING 2018 EARNINGS FORECASTS
Fourth-quarter earnings season has been outstanding. As good as it has been, perhaps most impressive is the strong guidance corporate America has provided. In response, we have raised our S&P 500 Index earnings forecast for 2018 and our S&P 500 year-end fair value target proportionately. Our revised year-end S&P 500 fair value range of 2950-3000, approximately 7-9% above Friday’s close, represents a 19.5 price-to-earnings (PE) ratio on $152.50 in earnings per share (EPS).
STRONG COMPANY GUIDANCE
Fourth-quarter earnings growth of over 15% reported by S&P 500 companies is outstanding, in our opinion, but the lead headline is the strong corporate guidance. That positive message has translated into a more than 7% increase in consensus S&P 500 operating earnings estimates for 2018 [Figure 1]. A ramp that swift and sharp, in an already favorable earnings environment, is unprecedented in our experience.
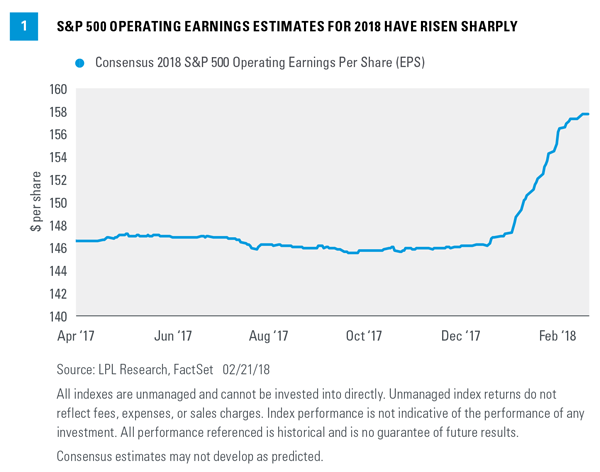
Most of that 7%-plus increase was driven by the new tax law, which we highlighted here in December 2017, noting it would favorably impact U.S. corporations due to a reduced tax burden, provision for immediate expensing, and repatriation of foreign-sourced profits. Given that estimates have historically dropped by an average of approximately 3% during earnings season, the recent 7% positive revision seems more like a 10% increase in potential corporate earnings growth. Of those three percentage points, perhaps one is a weak U.S. dollar, but that still leaves two percentage points of upside possibly driven by the favorable macroeconomic and business climate. Companies are optimistic, which is evident in business confidence surveys. This optimism traditionally translates into improved business investment.
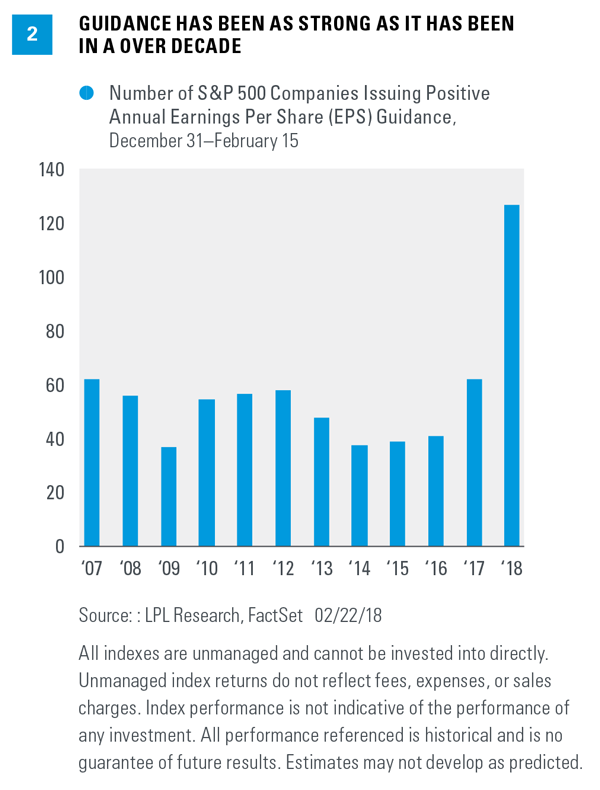
The breadth of optimism seems apparent when tallying the number of S&P 500 companies that have raised annual guidance during fourth-quarter earnings season and comparing those numbers over time. As shown in Figure 2, the number of companies raising guidance for this year is double the highest levels of the past decade for the same period.
UPDATING OUR 2018 EARNINGS FORECAST
In response to such a strong outlook from corporate America, we are raising our 2018 S&P 500 EPS target by $5 to $152.50, reflecting 15% expected earnings growth, up from our prior forecast of $147.50, or a 12% increase. We expect earnings to continue to get strong support from accelerating U.S. and global economic growth, a pickup in business spending, and strong manufacturing activity. We believe increasing costs, particularly wages, will only be a modest drag on profit margins. Share repurchases from overseas profits repatriated back to the United States may also provide an additional boost.
We want to emphasize that despite our optimism, our revised forecast for S&P 500 EPS remains below consensus, which currently hovers around $157.50 per share for 2018. We are comfortable with our forecast for several reasons:
- Expectations for U.S. dollar weakness may be overdone; a firming dollar may trim overseas profits for U.S.-based multinationals relative to current expectations.
- European economic growth may be peaking and could slow more than consensus expects as monetary policy support is potentially withdrawn.
- Current consensus estimates may be too high based on the historical calendar pattern.
As our earnings expectations rise, our expectations for stock market performance improve.
In conjunction with the 3% increase in our earnings forecast, we are raising our year-end S&P 500 fair value target proportionately, to 2950-3000, up from 2850-2900 previously and approximately 7-9% above Friday’s index close of 2747. Our new S&P 500 target reflects a PE multiple of 19.5 times our revised S&P 500 EPS forecast of $152.50. We indicated in our Outlook 2018: Return of the Business Cycle publication that we expected earnings to shoulder most, if not all of the load this year if stocks were going to produce attractive returns. Accordingly, as our earnings expectations rise, our expectations for stock market performance improve.
FOURTH QUARTER RECAP
Though guidance from corporate America has been the lead headline, strong fourth quarter numbers should not go unnoticed. As we noted in January’s earnings preview commentary, there were a number of reasons to expect strong results, including positive economic surprises, strong manufacturing data, the weak dollar, and resilient estimates heading into reporting season. Corporate America did not disappoint. Here are some of the highlights:
- Earnings and revenue growth, at 15.3% and 8.2% year over year, reached six-year highs.
- This marked the 35th straight quarter in which S&P 500 earnings beat consensus estimates.
- The 77% revenue beat rate is by far the best we’ve seen in the 10 years of available data.
- The earnings beat rate (77%) was solidly above the average of the current economic expansion (70%).
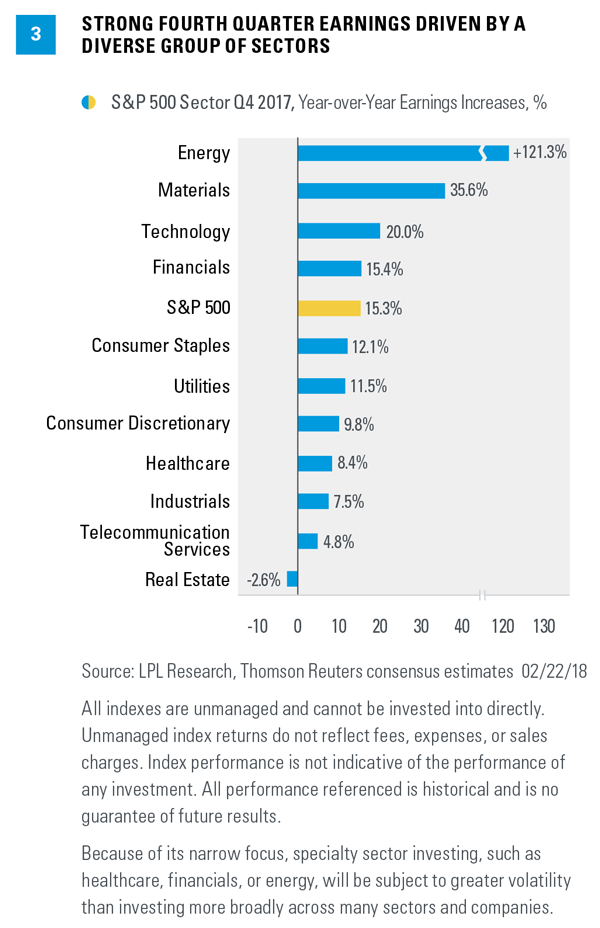
- A solid 10 of 11 S&P sectors produced year-over-year earnings growth [Figure 3], 9 of them over 7%, while only energy fell meaningfully short of estimates.
CONCLUSION
Fourth-quarter earnings season has produced exceptional results and very optimistic outlooks from corporate America that we think bode well for future earnings growth; as a result, we have raised our 2018 S&P 500 EPS forecast. As noted in our Outlook 2018, we believe 2018 earnings will be supported by stronger global economic growth, a pickup in business spending, and strong manufacturing activity in the United States. We also think operating margins will remain strong and stable, thanks to our expectation for only modest upward pressure on wages and other input costs. Plus the new tax law favorably impacts companies by reducing their tax burdens.
With earnings likely to be the primary driver of returns in 2018, our increase in earnings estimates for this year is being accompanied by an increase in our fair value target for the S&P 500 at year-end. We forecast S&P 500 earnings of $152.50 for the year, up 15% from 2017; and our new year-end S&P 500 fair value target range is 2950-3000. In terms of investor positioning, consistent with “a return to the business cycle,” we favor cyclical equity exposure, including small caps, value, financials, industrials, and technology.
Please see our Outlook 2018: Return of the Business Cycle publication for additional descriptions and disclosures.
IMPORTANT DISCLOSURES
The opinions voiced in this material are for general information only and are not intended to provide specific advice or recommendations for any individual. To determine which investment(s) may be appropriate for you, consult your financial advisor prior to investing. All performance referenced is historical and is no guarantee of future results.
The economic forecasts set forth in the presentation may not develop as predicted and there can be no guarantee that strategies promoted will be successful.
Investing in stock includes numerous specific risks including: the fluctuation of dividend, loss of principal, and potential liquidity of the investment in a falling market.
Because of its narrow focus, specialty sector investing, such as healthcare, financials, or energy, will be subject to greater volatility than investing more broadly across many sectors and companies.
Small cap stocks may be subject to a higher degree of risk than more established companies’ securities. The illiquidity of the small cap market may adversely affect the value of these investments.
All investing involves risk including loss of principal.
DEFINITIONS
Earnings per share (EPS) is the portion of a company’s profit allocated to each outstanding share of common stock. EPS serves as an indicator of a company’s profitability. Earnings per share is generally considered to be the single most important variable in determining a share’s price. It is also a major component used to calculate the price-to-earnings valuation ratio.
The PE ratio (price-to-earnings ratio) is a measure of the price paid for a share relative to the annual net income or profit earned by the firm per share. It is a financial ratio used for valuation: a higher PE ratio means that investors are paying more for each unit of net income, so the stock is more expensive compared to one with lower PE ratio.
INDEX DESCRIPTIONS
The Standard & Poor’s 500 Index is a capitalization-weighted index of 500 stocks designed to measure performance of the broad domestic economy through changes in the aggregate market value of 500 stocks representing all major industries.
This research material has been prepared by LPL Financial LLC.
To the extent you are receiving investment advice from a separately registered independent investment advisor, please note that LPL Financial is not an affiliate of and makes no representation with respect to such entity.
Not FDIC or NCUA/NCUSIF Insured | No Bank or Credit Union Guarantee | May Lose Value | Not Guaranteed by Any Government Agency | Not a Bank/Credit Union Deposit
Tracking #1-703516 (Exp. 02/19)