
KEY TAKEAWAYS
- Stocks have made a significant comeback, rallying nearly 6% off the recent lows.
- Solid fundamentals and technical indicators suggest that recent lows may hold.
- Historical relationships suggest stocks and yields can move higher together and stock valuations are justified based on current inflation levels.
OUT OF THE WOODS?
Are we out of the woods yet? After the fastest correction from a record high in the history of the S&P 500 Index, stocks staged an impressive comeback last week. The S&P 500 put together its best week since 2013, rallying more than 5% off the lows to bring its session win streak to six. This week we consider what this means moving forward, including what higher interest rates and rising inflation might mean for stocks.
STRONG FUNDAMENTALS
Whether we are out of the woods yet is a tough question to answer with any confidence, but when we weigh the evidence, it appears the odds are good that the worst is behind us.
The stock market’s strong fundamentals are supportive. U.S. economic growth is solid despite last week’s retail sales shortfall, which we attribute to temporary factors. Consumer and business confidence remain high, as personal spending and capital investment are both likely to get a boost from the new tax law. Inflation is rising, but remains relatively low when compared to historical averages. It also may not be as strong as the January Consumer Price Index (CPI) data initially suggested due to weather and other seasonal factors.
Earnings season has been excellent, with a 15% increase in S&P 500 earnings in the fourth quarter and an 8% revenue increase, both nicely above prior expectations. The new tax law hasn’t even kicked in yet, but analysts have increased their 2018 estimates for S&P 500 profits by $10 per share (nearly 7%) since January 1. Companies are just starting to announce how much in overseas cash they are repatriating back to the United States due to the new tax law. A good portion of that cash is expected to be directed to share repurchases, boosting earnings per share.
POSITIVE TECHNICAL EVIDENCE
From a technical perspective, here are some indicators supporting the view that the worst may be over:
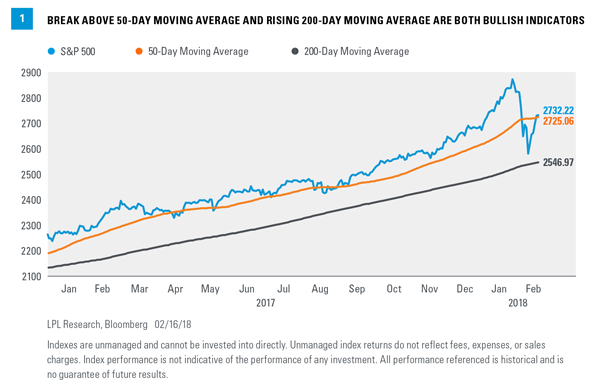
- Bullish trend intact. The S&P 500 broke back above its 50-day moving average (MA) on Thursday, February 15 (at 2721) and managed to close above the 200-day MA (2547 as of February 16) throughout its latest correction. The 200-day MA remains upward sloping, indicating a continued bullish technical trend [Figure 1].
- Evidence of capitulation selling. On February 5, when the Dow Jones Industrial Average dropped 1175 points, or 4.6%, the number of S&P 500 stocks declining relative to those advancing was greater than 40:1, indicative of extreme panic selling. The low percentage of stocks above their 50-day MA, below 20% on February 8, is another indicator of extreme selling pressure.
- Reversal from oversold levels. After entering oversold territory on February 8, based on the 14-day Relative Strength Index, the S&P 500 subsequently reversed and moved strongly higher while maintaining its bullish trend, a pattern that has historically proven to be a bullish technical signal.
- Strong rebound. Historically, when the weekly S&P 500 price closes 3% or more above its intra-week low, it has been a bullish short-term signal. This happened on February 9.
The combination of solid fundamentals and the technical evidence suggests to us the recent lows may hold. However, that does not rule out the likelihood that the return to normal volatility brings more daily moves of 1% (or more) and 5-10% pullbacks over the course of the year.
HOW WORRIED SHOULD WE BE ABOUT RISING RATES?
The latest downdraft was triggered primarily by accelerating wage growth that sparked fears of rising inflation and a more aggressive Federal Reserve (Fed). As such, we think it is helpful to examine the historical relationships between stocks, inflation, and interest rates.
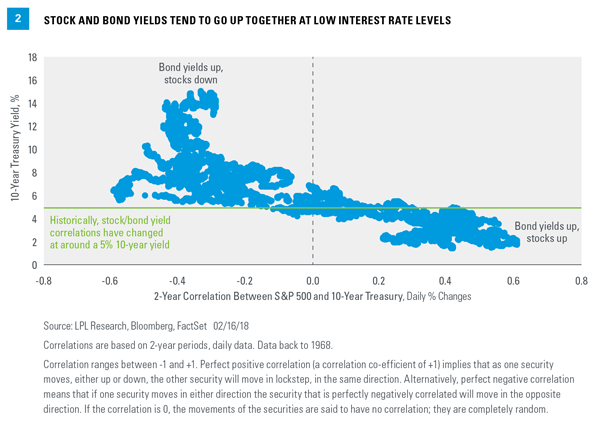
With regard to interest rates, Figure 2 illustrates that historically, when the 10-year yield has been below 5%, the stock market and interest rates have tended to move together (positive correlations), meaning stocks can go up despite rising rates. When rates are relatively low, rising rates usually indicate improving growth, as is evident today.
At higher interest rate levels, rising interest rates have tended to spook stock investors as the Fed gets more aggressive and borrowing costs rise (negative correlation in Figure 2). With the 10-year yield not having eclipsed 3% during this latest bond market sell-off, we think we may have a ways to go before the level of interest rates impairs economic activity and/or the stock market, even if the relationship reverses at lower interest levels than what we’ve seen historically.
The exception would be if rates potentially spike again, because the speed at which rates move can be as important as the level. This is something to watch, but we continue to expect only a gradual increase in the benchmark 10-year Treasury yield; our year-end forecast remains 2.75-3.25%.
…AND HIGHER INFLATION?
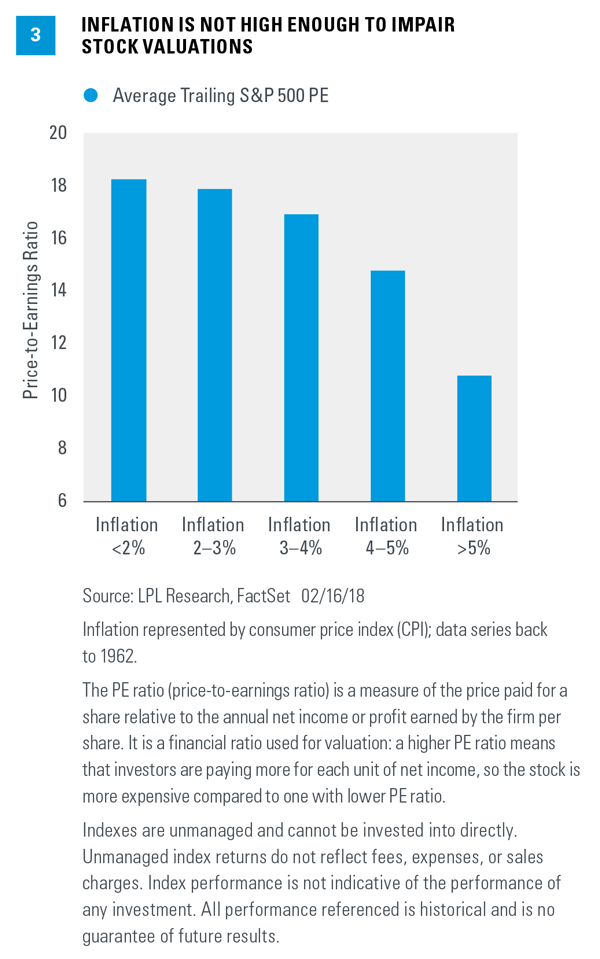
We can also look at the relationship between inflation and the stock market. Figure 3 shows that at low inflation levels, the price-to-earnings ratio (PE) for the S&P 500 tends to be higher, and vice versa. With the CPI right around 2%, we think stock valuations at current levels of about 17 times the next 12-month earnings estimates are reasonable.
If the S&P 500 delivers the consensus earnings number for 2018 ($157 per share), then it would only take a trailing PE slightly over 18 to get to our fair value S&P 500 target range of 2850-2900 at year-end. From Friday’s close at 2732, that level of the S&P 500 would represent 4-6% upside. Keep in mind that the average PE when inflation is below 3% historically has been over 18 times. At current inflation levels, we see stock valuations as quite reasonable, especially when considering the solid economic and profit backdrop.
CONCLUSION
We maintain our positive outlook for stocks despite the recent bout of volatility as fundamentals remain solid in our view. As we wrote in our Outlook 2018: Return of the Business Cycle publication, the combination of improved business fundamentals and fiscal legislation may sustain momentum in the economy and equity markets in the coming year and potentially beyond. After years of depending on the largess of monetary policymakers, investors can now focus on fiscal levers that we believe will support consumption and spur new business investment over the next few years.
In terms of investor positioning, consistent with a “return to the business cycle,” we favor cyclical equity exposure. Small caps may benefit from the new tax law due to their relatively higher tax burden. We believe the value style of investing may get a boost from fiscal legislation, with many value names poised to benefit from tax cuts and reduced regulation, notably financials. Meanwhile, the industrial sector may benefit from a combination of lower taxes, 100% expensing, higher U.S. government defense spending, and accelerating global growth. The technology sector is also poised to benefit from solid global growth, in addition to the large trove of profits held overseas that now have the opportunity to be repatriated at attractive rates.
Thanks to David Tonaszuck for his contributions to this report.
IMPORTANT DISCLOSURES
The opinions voiced in this material are for general information only and are not intended to provide specific advice or recommendations for any individual. To determine which investment(s) may be appropriate for you, consult your financial advisor prior to investing. All performance referenced is historical and is no guarantee of future results.
The economic forecasts set forth in the presentation may not develop as predicted and there can be no guarantee that strategies promoted will be successful.
Investing in stock includes numerous specific risks including: the fluctuation of dividend, loss of principal, and potential liquidity of the investment in a falling market.
Because of its narrow focus, sector investing will be subject to greater volatility than investing more broadly across many sectors and companies.
Investing involves risks including possible loss of principal. No investment strategy or risk management technique can guarantee return or eliminate risk in all market environments.
DEFINITIONS
The 200-day moving average (MA) is a popular technical indicator which investors use to analyze price trends. It is the security or index’s average closing price over the last 200 days.
Relative Strength Index (RSI) is a technical momentum indicator that compares the magnitude of recent gains with recent losses in an attempt to determine overbought and oversold conditions of an asset.
Yield curve is a line that plots the interest rates, at a set point in time, of bonds having equal credit quality, but differing maturity dates. The most frequently reported yield curve compares the 3-month, 2-year, 5-year and 30-year U.S. Treasury debt. This yield curve is used as a benchmark for other debt in the market, such as mortgage rates or bank lending rates. The curve is also used to predict changes in economic output and growth.
The PE ratio (price-to-earnings ratio) is a measure of the price paid for a share relative to the annual net income or profit earned by the firm per share. It is a financial ratio used for valuation: a higher PE ratio means that investors are paying more for each unit of net income, so the stock is more expensive compared to one with lower PE ratio.
Forward price-to-earnings is a measure of the price-to-earnings ratio (PE) using forecasted earnings for the PE calculation. While the earnings used are just an estimate and are not as reliable as current earnings data, there is still benefit in estimated PE analysis. The forecasted earnings used in the formula can either be for the next 12 months or for the next full-year fiscal period.
Earnings per share (EPS) is the portion of a company’s profit allocated to each outstanding share of common stock. EPS serves as an indicator of a company’s profitability. Earnings per share is generally considered to be the single most important variable in determining a share’s price. It is also a major component used to calculate the price-to-earnings valuation ratio.
INDEX DESCRIPTIONS
The Standard & Poor’s 500 Index is a capitalization-weighted index of 500 stocks designed to measure performance of the broad domestic economy through changes in the aggregate market value of 500 stocks representing all major industries.
The Dow Jones Industrial Average (DJIA) Index is comprised of U.S.-listed stocks of companies that produce other (nontransportation and nonutility) goods and services. The Dow Jones Industrial Averages are maintained by editors of The Wall Street Journal. While the stock selection process is somewhat subjective, a stock typically is added only if the company has an excellent reputation, demonstrates sustained growth, is of interest to a large number of investors, and accurately represents the market sectors covered by the average. The Dow Jones averages are unique in that they are price weighted; therefore, their component weightings are affected only by changes in the stocks’ prices.
This research material has been prepared by LPL Financial LLC.
To the extent you are receiving investment advice from a separately registered independent investment advisor, please note that LPL Financial is not an affiliate of and makes no representation with respect to such entity.
Not FDIC or NCUA/NCUSIF Insured | No Bank or Credit Union Guarantee | May Lose Value | Not Guaranteed by Any Government Agency | Not a Bank/Credit Union Deposit
Tracking #1-701630 (Exp. 02/19)