
FOCUSING ON FUNDAMENTALS
John Lynch Chief Investment Strategist, LPL Financial
BARRY GILBERT, PHD, CFA Asset Allocation Strategist, LPL Financial
KEY TAKEAWAYS
-
As financial markets fluctuate, we encourage investors to focus on solid U.S. economic fundamentals.
-
U.S. GDP has grown at its fastest pace since 2014, while Fed Beige Book context is still historically upbeat.
-
The effects of trade tensions, however, are starting to appear in the economic data.
Financial markets have had the roughest October in years as investors have grown wary over future corporate profits and the Federal Reserve’s (Fed) monetary policy plans. Even as markets fluctuate, we encourage investors to focus on the fundamentals. We remain optimistic about the U.S. economy, and we believe that continued solid growth would likely support corporate profits and asset prices.
Third-quarter gross domestic product (GDP) and the Fed’s Beige Book—both released last week—confirmed that the U.S. economy is on solid footing. Third- quarter GDP, which grew 3.5%, topped the Bloomberg-surveyed economists’ median consensus forecast. While healthy growth remains the main story investors should focus on, there are signs that global trade tensions are having an impact on the global and U.S. economies. We continue to believe that the impact will be small relative to the overall impact of fiscal stimulus, but we are starting to see the effects of trade tensions appear in the hard economic data, particularly around business spending.
SOLID GROWTH OUTLOOK
GDP grew 3.5% last quarter, boosting average growth over the last two quarters to 3.9%, the strongest pace since 2014 [Figure 1]. Last quarter’s growth in output was driven by strong consumer spending, as well as the biggest contribution from private inventories in years. The strong undercurrent of consumer demand continues to drive the economy, aided by accelerating incomes and fiscal stimulus. Change in private inventories is typically a volatile component of output, so we wouldn’t be surprised to see some of this tailwind reverse and weigh on fourth-quarter growth. However, other economic data support the trend of increasing inventories, and we interpret this as a positive sign for continued strong demand. Government spending’s contribution to third-quarter GDP was also higher than average, thanks to a surge in state and local expenditures.
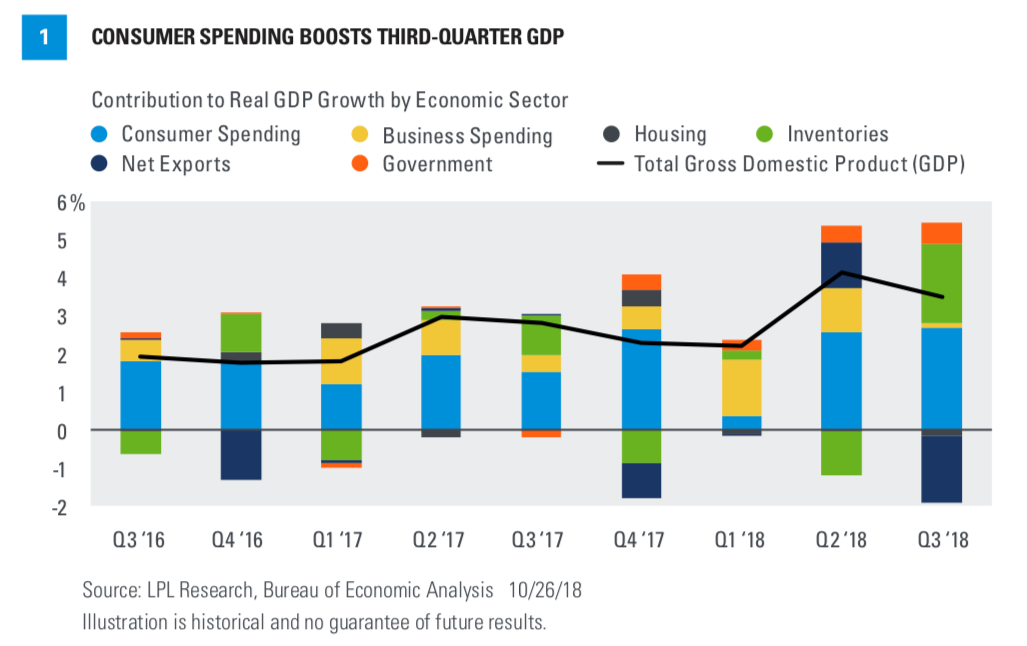
While growth has been strong over the last several quarters, overall confidence has also been boosted by how steady the economy has been. U.S. GDP has grown at least 2% for six straight quarters, the first such streak since the first quarter of 2005.
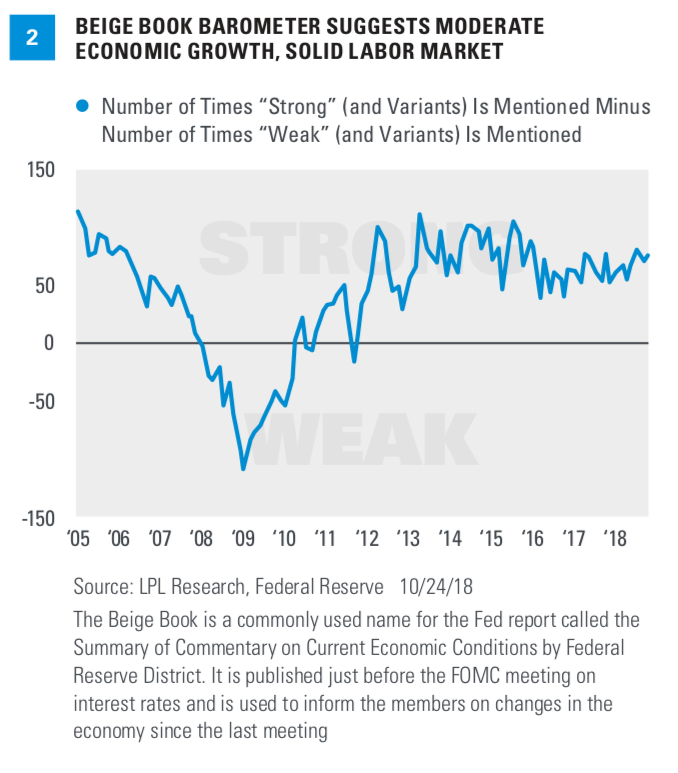
The Fed’s latest Beige Book, which reflects data collected in the weeks before October 15, shows that Main Street’s outlook aligns with continued steady economic growth. The Beige Book is a qualitative assessment of the domestic economy and each of the 12 Fed districts that are prepared eight times per year. At LPL Research, we maintain a straightforward (but informative) indicator called the Beige Book Barometer (BBB), which measures the difference between the number of times the word “strong” or its variants appears in the Beige Book and the number of times the word “weak”
or its variants appear. When the BBB is declining, it suggests the economy is deteriorating; when it’s advancing, it suggests the economy is improving.
The BBB’s headline reading was +76 in October, higher than a September reading of +71 and above its 12-month rolling average of +67 [Figure 2]. There were 95 strong words in the October Beige Book, the most in 18 months. Weak words ticked up to 19, the most since November 2017. However, weak words remain near expansion lows, reflecting a solid macroeconomic environment.
TRADE ANXIETY
Although both reports showed solid growth, the underlying details hinted at areas of concern, primarily among U.S. businesses amid uncertainty from trade tensions and higher costs. The biggest drag on last quarter’s GDP was a decline in net exports, and both exports and imports were net drags on headline GDP for the first quarter since the fourth quarter of 2016. Business’s fixed investment contributed 0.1% to GDP, about 0.4% below its 3-year average contribution. These numbers are confirmed by recent data on orders and shipments of core capital goods, which, on a year-over-year basis, both slowed in September to levels not seen since 2014. Cooling in business spending is concerning, considering new tax policy incentivizes firms to invest in capital equipment, and reflects the growing influence of trade fears on companies’ decisions and outlooks. While we still believe capital expenditures will pick up in the intermediate term, this is an important trend we will continue to monitor.
Business’s concerns were also front and center in the October Beige Book. Trade-related words appeared 82 times, the highest number of mentions since we began tracking trade references at the beginning of 2017. Last year, trade-related words appeared an average of just over 13 times in each Beige Book. In the most recent Beige Book, “tariffs” appeared 51 times (versus 36 times in the September edition), while “trade” itself appeared 28 times.
Over the past several months, we’ve also observed trade tensions weigh on businesses through increased input costs and supply chain constraints. Based on the latest Beige Book, the economic impacts of trade may now be flowing through to selling prices. Overall, the Beige Book observes:
Even so, districts reported “modest to moderate” gains in consumer prices, which aligns with the approximately 2% annual growth in consumer inflation data. While price gains are currently contained, higher prices (should they appear) could impact confidence and spending, especially as the benefits of fiscal stimulus fade away. Rising prices could also dampen economic growth by forcing the Fed to quicken its pace of monetary tightening. Our base case, however, is still that inflation will remain contained, supported by downside surprises
in inflation data over the last several months, including in the GDP report.
Respondents in the Beige Book also noted continued supply chain disruptions, mainly from breakdowns in global trade and an increasing shortage of labor. While rising inventories were a boon to growth last quarter, some of the build could be from these disruptions, as multiple districts reported increased delivery times and mismatched inventories. Supply chain obstacles and declining international demand can eventually hinder domestic companies’ growth prospects. To combat this, a few respondents stated they are closing gaps in production by ramping up capital expenditures and reorganizing their supply chains.
The historically tight labor market also hampered hiring in several districts, leading to increased wages and constrained growth. Even so, the pace of wage growth was characterized as “modest to moderate,” with employers resorting to non-salary benefits over pay increases to attract and retain workers. We view the current pace of wage growth as a net benefit to the U.S. economy, as modestly accelerating wages boost personal incomes. However, wages represent about 70% of business costs, so surging labor
costs (in conjunction with higher input costs) can eventually put pressure on profit margins.
CONCLUSION
To be clear, U.S. economic growth is still solid, and the tailwind from fiscal stimulus outweighs the headwind of trade uncertainty. We still believe the U.S. is in the later stage of an economic expansion, but, supported by fiscal stimulus, the later stage can last for some time. While we expect growth to slow over the coming quarters, we still expect it to remain above average, which may continue to support asset prices. However, we understand that trade tensions and a slowdown in international growth have complicated the macroeconomic environment, and these headwinds remain risks to our base case. We will continue to monitor risks, but remain focused on solid economic fundamentals for the U.S.
The opinions voiced in this material are for general information only and are not intended to provide specific advice or recommendations for any individual. To determine which investment(s) may be appropriate for you, consult your financial advisor prior to investing. All performance referenced is historical and is no guarantee of future results.Any economic forecasts set forth in the presentation may not develop as predicted and there can be no guarantee that strategies promoted will be successful. Investing involves risk including loss of principal.
DEFINITIONS
The PE ratio (price-to-earnings ratio) is a measure of the price paid for a share relative to the annual net income or profit earned by the firm per share. It is a financial ratio used for valuation: a higher PE ratio means that investors are paying more for each unit of net income, so the stock is more expensive compared to one with lower PE ratio.
Gross domestic product (GDP) is the monetary value of all the finished goods and services produced within a country’s borders in a specific time period, though GDP is usually calculated on an annual basis. It includes all of the private and public consumption, government outlays, investments, and exports fewer imports that occur within a defined territory.
This research material has been prepared by LPL Financial LLC.
To the extent you are receiving investment advice from a separately registered independent investment advisor, please note that LPL Financial LLC is not an affiliate of and makes no representation with respect to such entity.
Not FDIC or NCUA/NCUSIF Insured | No Bank or Credit Union Guarantee | May Lose Value | Not Guaranteed by Any Government Agency | Not a Bank/Credit Union Deposit.
RES 33443 1018 | For Public Use | Tracking #1-786990 (Exp. 10/19)