
EARNINGS UPDATE: SO FAR SO GOOD
John Lynch Chief Investment Strategist, LPL Financial
Jeffrey Buchbinder CFA Equity Strategist, LPL Financial
KEY TAKEAWAYS
- With about one-fifth of third-quarter earnings results in, the numbers have been solid thus far despite tariffs and increasing wage pressures.
- We expect the good results to continue based on the favorable U.S. macroeconomic environment, including robust manufacturing activity and strong nominal GDP growth.
- We’ll be keeping an eye on profit-margin pressures, an eventual growth, and China-U.S. trade tensions, plus possible slower growth in Europe.
Earnings season off to a good start. Third quarter earnings season is rolling and, so far, results have been quite good overall, supported by strong U.S. economic growth, robust U.S. manufacturing activity, tax cuts, and big increases in energy and financials sector profits. Below we recap the results of earnings season thus far, discuss why we expect strong results to continue throughout the reporting season, and highlight several keys we are watching.
GOOD NUMBERS SO FAR
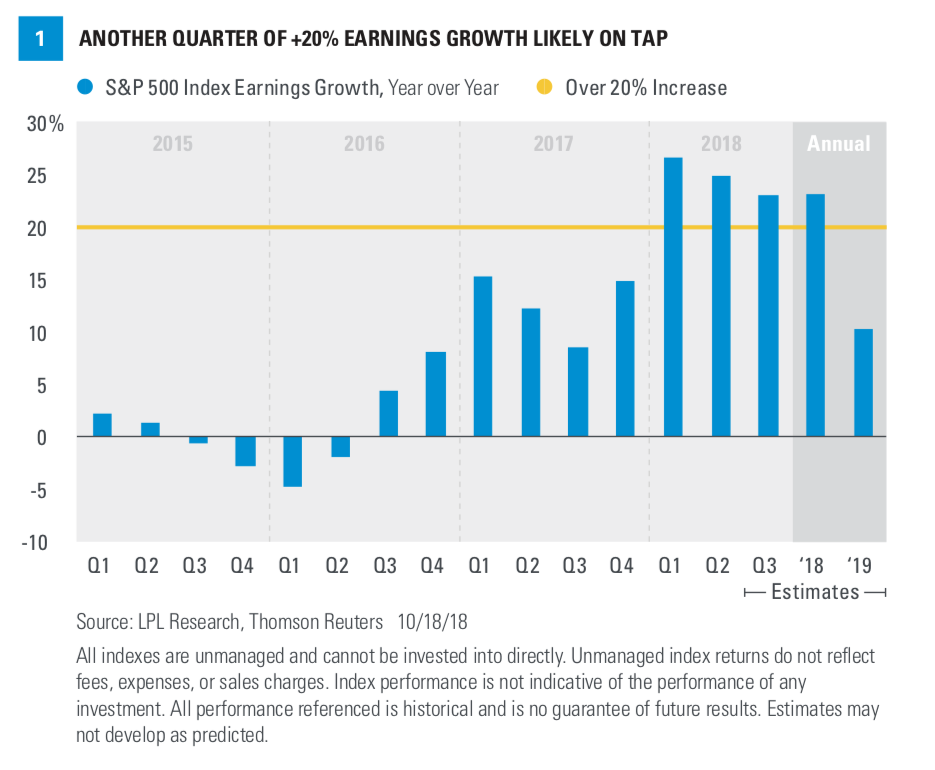
We’re not even 20% through third quarter earnings results, but the numbers have been solid thus far despite pressure on profit margins from tariffs and higher wages. With 84 S&P 500 companies having reported, year-over-year earnings growth for the index is tracking to 22%, slightly above the 21.6% figure at quarter end and 3 percentage points lower than the second quarter [Figure 1]. Revenue growth is tracking to a solid 7.3% increase, below last quarter’s 9.5% increase. A solid and above-average 79% of companies have beaten earnings estimates, while the share of companies that have beaten revenue targets—62%—is above the long-term average of 60%, but below the 73% average of the past four quarters. The modest upside to estimates and drop in the revenue beat rate indicate a smaller upside surprise to the current 22% pace is likely—but a potential 23–24% earnings growth rate is hardly something to sneeze at.
Looking ahead, despite the aforementioned margin headwinds and slowing growth in key overseas economies, notably Europe and China, estimates for the current fourth quarter (calling for growth of over 20%) and 2019 (an increase of more than 10%) have barely budged in October. Resilient estimates are encouraging amid several company anecdotes about tariff impacts and slower growth overseas.
POSITIVE MACRO SIGNALS
We think the good results will continue this earnings season for a number of reasons. Most obvious
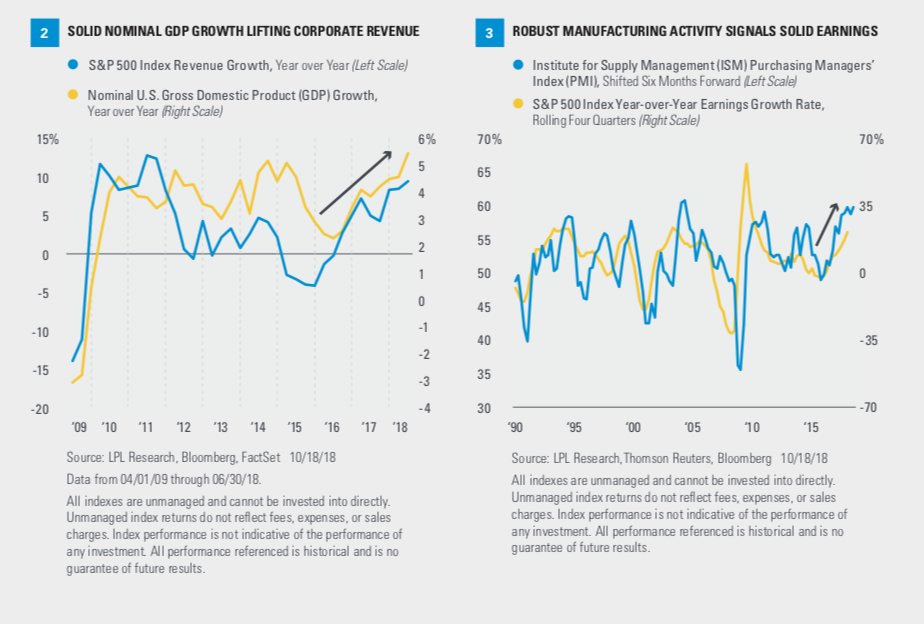
is the favorable macroeconomic environment. In the U.S., economic growth has picked up and manufacturing activity is humming. Along those lines, two of our favorite earnings relationships are shown in Figures 2 and 3.
Figure 2 shows the relationship between nominal GDP growth (real GDP growth plus inflation) and S&P 500 revenue. You see that as economic growth accelerates, revenue growth tends to improve as well. We certainly saw this relationship hold in the second quarter of 2018 when nominal GDP growth rose at its fastest level of the economic expansion: 5.4% on a year-over-year basis and 7.6% quarter over quarter annualized. We believe the outlook for corporate profits over the next several quarters is positive, supported by upward trajectories in economic growth—bolstered by fiscal stimulus— and inflation.
A healthy manufacturing sector also bodes well for the earnings outlook, as shown in Figure 3. Because of S&P 500 companies’ emphasis on manufacturing, the Institute for Supply Management (ISM) Purchasing Managers’ Index for Manufacturing has historically correlated well with year-over-year S&P 500 earnings growth, with about six months of lead time. With the index level at roughly 60 and near expansion highs, we believe the strong earnings momentum from the second quarter will continue through year-end and probably beyond (even though the anniversary of the December 2017 tax cuts will cause earnings growth to slow in the first quarter of 2019).
OTHER POSITIVE SIGNS
At a more micro level, company pre-announcements ahead of reporting season can give us a sense of where results may come in. At 2.0, the ratio of negative to positive pre-announcements for the third quarter is more negative than the second quarter and last year’s third quarter, but it’s better than the long-term average of 2.8 (Thomson Reuters’ data since 1995). We interpret this as an indicator of upside to S&P 500 earnings estimates, but probably more modest upside than in recent quarters.
Similarly, revisions to analysts’ earnings estimates can tell us something about how results will come in. Since the third quarter ended on September 30, estimates for the third quarter have been inching higher, but estimates were cut by 1.6% during the quarter (July through September). The good news is that the intra-quarter reduction was below average, suggesting that results will probably exceed estimates as they typically do.
WHAT TO WATCH
In last week’s earnings preview on www.lplresearch.com, we highlighted three factors we will be watching during earnings season:
- Pressure on profit margins: Tariffs, (slowly) rising borrowing costs, and budding wage pressures have put investors on notice for potential narrowing of profit margins.
- Peak earnings growth: Earnings growth is still strong but is likely to slow for a while. It’s important to keep in mind that a peak in earnings growth is very different from an earnings decline, which is likely a long way off. Historically, an average of about four years have passed between a peak in S&P 500 earnings growth and the subsequent recession, during which time stocks have tended to produce solid gains.
- China-U.S. trade tensions: China will be important to watch again this earnings season given tariffs, the ongoing trade dispute, and the country’s growth slowdown.
We like lists of threes, but if you wanted a fourth key it would be slower growth in Europe. This quarter we expect more companies to cite the impact of slower growth in Europe than in recent quarters.
CONCLUSION
Third quarter earnings season is off to a good start and we expect the positive trend to continue. A strong U.S. economy and healthy manufacturing sector are providing solid support, while pre-announcements and estimate revisions point to another quarter of better-than-expected results.
The likely peak in earnings growth is of little concern to us given the amount of time between previous peaks in earnings growth and eventual recessions. Of greater concern is the building pressure on profit margins due to a combination of tariffs and accelerating wage increases. As a result, we are interested in hearing about how higher costs are impacting companies’ bottom lines and what preparations they are making for potential additional tariffs on Chinese goods. Slower growth in China and Europe are also of concern.
While we recognize the potential for additional market volatility around the midterm elections and as the U.S.-China trade dispute remains unresolved, we continue to forecast year-end fair value for the S&P 500 at 2900–3000.* That target is based on a price-to-earnings multiple of 19 and a likely conservative $155 in S&P 500 earnings per share for 2018 (Thomson Reuters consensus estimates are around $160), implying a low-double-digit return for 2018. The S&P 500 has returned 5.1% year-to-date return through Friday, October 19.
IMPORTANT DISCLOSURES
The opinions voiced in this material are for general information only and are not intended to provide specific advice or recommendations for any individual. To determine which investment(s) may be appropriate for you, consult your financial advisor prior to investing. All performance referenced is historical and is no guarantee of future results.
The economic forecasts set forth in the presentation may not develop as predicted and there can be no guarantee that strategies promoted will be successful.
Investing involves risks including possible loss of principal. No investment strategy or risk management technique can guarantee return or eliminate risk in all market environments.
INDEX DESCRIPTIONS
The Standard & Poor’s 500 Index is a capitalization-weighted index of 500 stocks designed to measure performance of the broad domestic economy through changes in the aggregate market value of 500 stocks representing all major industries.
The Purchasing Managers’ Index (PMI) is an indicator of the economic health of the manufacturing sector. The PMI is based on five major indicators: new orders, inventory levels, production, supplier deliveries, and the employment environment.
The Institute for Supply Management (ISM) Manufacturing Index is an economic indicator derived from monthly surveys of private sector companies, and is intended to show the economic health of the U.S. manufacturing sector. A PMI of more than 50 indicates expansion in the manufacturing sector, a reading below 50 indicates contraction, and a reading of 50 indicates no change.
To the extent you are receiving investment advice from a separately registered independent investment advisor, please note that LPL Financial LLC is not an affiliate of and makes no representation with respect to such entity.
Not FDIC or NCUA/NCUSIF Insured | No Bank or Credit Union Guarantee | May Lose Value | Not Guaranteed by Any Government Agency | Not a Bank/Credit Union Deposit.
RES 31514 1018 | For Public Use | Tracking #1-784549 (Exp. 10/19)