
PERSPECTIVE ON MARKET VOLATILITY
John Lynch Chief Investment Strategist, LPL Financial
Ryan Detrick, CMT Senior Market Strategist, LPL Financial
Jeffrey Buchbinder CFA Equity Strategist, LPL Financial
KEY TAKEAWAYS
- Stocks fell sharply late last week amid a plethora of concerns, primarily rising interest rates and trade.
- We share our perspective on the sell-off and discuss where stocks may go from here.
- Technical analysis and sentiment measures indicate stocks may be near a bottom.
After several months of historic calm, stocks sold off sharply last week. Rising interest rates and trade war fears were cited as the primary causes of the sell-off that caused the Dow Jones Industrial Average to drop more than 1300 points on Wednesday and Thursday combined. Concerns about corporate profit margins peaking and a potentially overcrowded tech trade also likely played a role in upsetting a market that had been extraordinarily calm over the past six months. The S&P 500 Index did manage to pare losses, thanks to solid gains on Friday, but still ended the week down over 4%, for the worst week since March. Here we share some perspective on the latest bout of market volatility, which is not particularly unusual and share our thoughts on where stocks may go from here.
IS THIS NORMAL?
This volatility should not be all that surprising, for a number of reasons. Going back to 1950, no month has seen more 1% changes in the S&P 500 (up or down) than the month of October. Stocks were coming off of one of the least volatile third quarters in many decades. Last week’s slide means the S&P 500 has endured three pullbacks of 5–10% this year, which is in line with the long-term average. And, volatility ahead of elections is not unusual. In fact, ahead of the November 2016 presidential election the S&P 500 fell nine consecutive days—one of the longest losing streaks ever. So while pullbacks are unwelcome, they are a normal part of long-term investing.
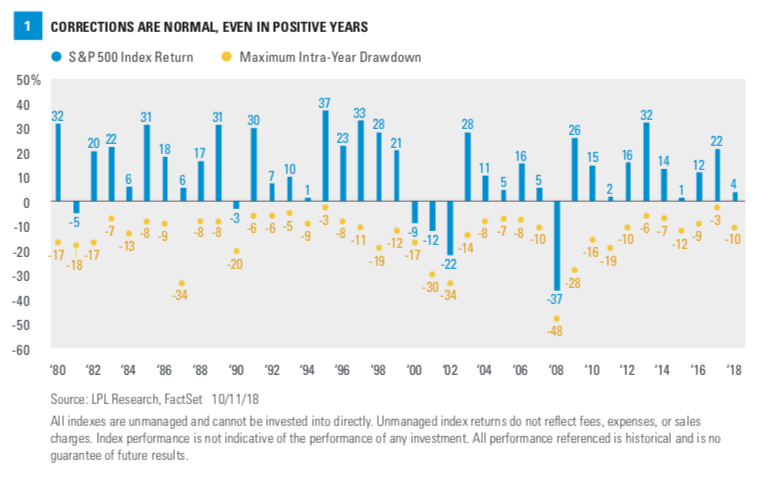
One of our favorite charts highlights this point [Figure 1]. The S&P 500 has produced a positive total return (with dividends) in 33 of the past 39 years going back to 1980. During that period, the average maximum peak-to-trough decline in the index was 14%. Even during positive years, the average maximum drawdown in the index was 11%. The correction in January and February of this year was about 11%, right in line with the average correction during positive years. We obviously don’t know where stocks go from here, but at this point, we would say that last week’s volatility is not particularly unusual.
WHERE DO WE GO FROM HERE?
Looking ahead, we see a number of reasons to maintain our positive U.S. stock market outlook:
We are entering a favorable seasonal period. Over the four-year presidential cycle, the current quarter and the next two have historically been the best. The average 12-month gain off midterm election year lows is over 30%, and since 1946 the S&P 500 has never been down over the 12 months following midterm elections (18 for 18). In general, fourth quarters are the best quarter of the year for stocks, and the historically best six-month period for stocks starts November 1.
The U.S. economy is in excellent shape. Consumer spending is growing solidly, consumer and business confidence is high, the job market is quite strong, manufacturing surveys are near record levels, and, by historical standards, interest rates are still fairly low. All of our favorite leading indicators point to continued economic growth, and we see only early signs of excesses that have ended past economic cycles, such as excess leverage, overspending, or extreme overconfidence. Even the yield curve has steepened some in recent weeks, a positive signal.
Corporate profits remain quite strong. S&P 500 earnings are expected to grow 21% in the third quarter based on FactSet consensus estimates, supported by strong U.S. economic growth and tax cuts (see our latest blog on www.lplresearch.com for an earnings season preview ). Third quarter estimates held up relatively well during the quarter, a positive sign, and tariff impact has been minimal to date.
Stocks and interest rates can rise together if…stronger economic growth is driving rates, as we believe is the case now. When rates spike over a short period of time, as in the “taper tantrum” in 2013, volatility usually spikes as well. However, we think much of the increase in interest rates is now behind us and additional moves higher should be gradual, which should enable stocks to settle down in fairly short order. Despite losses in many fixed income sectors this year, we continue to believe bonds can play important roles in portfolios as diversifiers.*
Despite tough rhetoric from both sides, we see a U.S.-China trade deal as likely. Though a deal will not happen until after the midterms, we believe the two parties have too much to lose to not find the middle ground. Regardless, the amount of fiscal stimulus put into place in the U.S. this year should far outweigh the dollar amount of tariffs either implemented or threatened.
ARE STOCKS WASHED OUT?
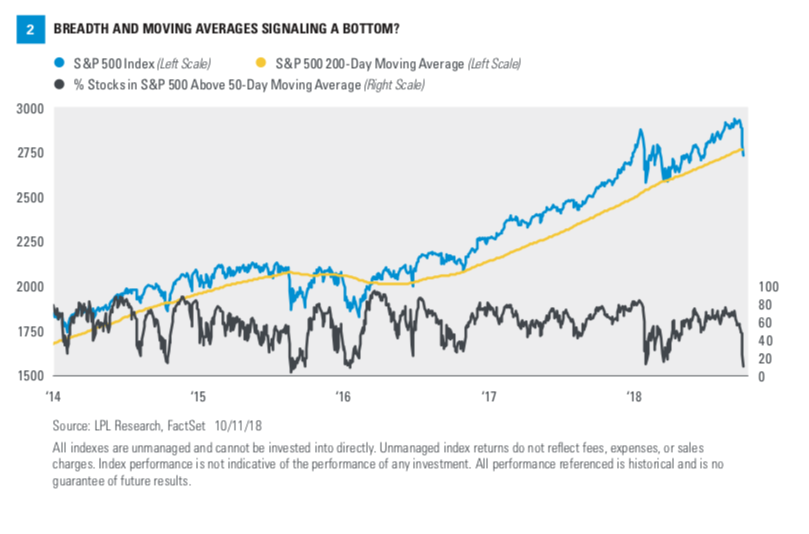
Last week we were asking ourselves an important question: Was the volatility dramatic enough to be considered capitulation? After a 5% drop in two days, we see several data points that suggest stocks could potentially be at or near lows. For starters, since the Brexit vote in June 2016, the S&P 500 has found support multiple times right at its 200-day moving average. As Figure 2 shows, the S&P 500 is near this important trend line once again. Although we would prefer the S&P 500 stay above this trend line, history tells us the trend’s direction is more important. Fortunately, it is still pointing firmly higher, which bodes well for an eventual continuation of the bull market.
From a technical analysis perspective, how much damage was done during last week’s sell-off? Well, as Figure 1 shows, only 11% of the components in the S&P 500 closed above their 50-day moving average after Thursday’s sharp decline—meaning 89% did not. This was the lowest level for this metric since early 2016. Additionally, the 14-day Relative Strength Index (RSI) on the S&P 500 hit its lowest level since August 2015. This popular momentum indicator, which measures overbought and oversold conditions, provided yet another clue that last week represented potential capitulation, or a washout, for stocks.
Some popular sentiment measures indicate investors have turned very bearish, which is what we want to see from a contrarian point of view:
- For the week ending October 10, the American Association of Individual Investors (AAII) Investor Sentiment Survey saw the number of bulls drop by 15% (from 46% to 31%), the largest weekly drop for bulls in nearly a year.
- The five-day moving average of the Chicago Board Options Exchange (CBOE) equity put/call ratio (a derivatives-based sentiment measure) soared to its highest level since early February, suggesting derivatives traders got nervous.
- The CNN Fear & Greed Index, a propriety sentiment measure that incorporates various sentiment measures, sank to 5 last week (out of a 0–100 scale). Readings for the past two weeks were lower than those observed during the severe energy downturn in early 2016.
Bottom line, we think investor sentiment measures reflect enough pessimism to suggest stocks may be near a bottom.
CONCLUSION
Given the market’s steady advance over the past six months and a historic lack of volatility, a pullback was probably overdue. Volatility never feels good, especially when it has been a while since investors have experienced it. But it is a normal part of a bull market entering its latter stages. Though it is certainly possible this sell-off gets worse before it gets better, our belief is that it is unlikely to develop into a bear market. We maintain our S&P 500 year-end fair value target of 2900–3000 (the S&P 500 closed at 2767 on Friday).
We encourage investors to view the recent market volatility as an opportunity to reassess portfolios and look for spots to either deploy cash or rebalance to longer-term allocation targets, where suitable. If you are over-allocated to growth, particularly in the mega-cap technology arena, this may be a good time to consider rebalancing. More active strategies on the part of investors may be required to pursue long-term goals. For long-term investors, volatility should be embraced, not feared, especially against a backdrop of solid fundamentals.
*For more on stock performance during rising rates, see the Weekly Market Commentary from 09/24/18.
Please see the Midyear Outlook 2018: The Plot Thickens publication for additional descriptions and disclosures.
The opinions voiced in this material are for general information only and are not intended to provide specific advice or recommendations for any individual. To determine which investment(s) may be appropriate for you, consult your financial advisor prior to investing. All performance referenced is historical and is no guarantee of future results.
The economic forecasts set forth in the presentation may not develop as predicted and there can be no guarantee that strategies promoted will be successful.
Investing in foreign securities involves special additional risks. These risks include, but are not limited to, currency risk, political risk, and risk associated with varying accounting standards. Investing in emerging markets may accentuate these risks.
Because of its narrow focus, specialty sector investing, such as healthcare, financials, or energy, will be subject to greater volatility than investing more broadly across many sectors and companies.
Investing involves risks including possible loss of principal. No investment strategy or risk management technique can guarantee return or eliminate risk in all market environments.
All indexes are unmanaged and cannot be invested into directly. Unmanaged index returns do not reflect fees, expenses, or sales charges. Index performance is not indicative of the performance of any investment.
All information is believed to be from reliable sources; however, LPL Financial makes no representation as to its completeness or accuracy.
DEFINITIONS
The PE ratio (price-to-earnings ratio) is a measure of the price paid for a share relative to the annual net income or profit earned by the firm per share. It is a financial ratio used for valuation: a higher PE ratio means that investors are paying more for each unit of net income, so the stock is more expensive compared to one with lower PE ratio.
Gross domestic product (GDP) is the monetary value of all the finished goods and services produced within a country’s borders in a specific time period, though GDP is usually calculated on an annual basis. It includes all of private and public consumption, government outlays, investments, and exports less imports that occur within a defined territory.
INDEX DESCRIPTIONS
The Standard & Poor’s 500 Index is a capitalization-weighted index of 500 stocks designed to measure performance of the broad domestic economy through changes in the aggregate market value of 500 stocks representing all major industries.
The MSCI Emerging Markets Index is a free float-adjusted market capitalization index that is designed to measure equity market performance of emerging markets. The MSCI Emerging Markets Index consists of the following 21 emerging market country indices: Brazil, Chile, China, Colombia, Czech Republic, Egypt, Hungary, India, Indonesia, Korea, Malaysia, Mexico, Morocco, Peru, Philippines, Poland, Russia, South Africa, Taiwan, Thailand, and Turkey.
The MSCI All Country World Index is an unmanaged, free float-adjusted, market capitalization-weighted index composed of stocks of companies located in countries throughout the world. It is designed to measure equity market performance in global developed and emerging markets. The index includes reinvestment of dividends, net of foreign withholding taxes.
The MSCI EAFE Index is made up of approximately 1,045 equity securities issued by companies located in 19 countries and listed on the stock exchanges of Europe, Australia, and the Far East. All values are expressed in U.S. dollars. Past performance is no guarantee of future results.
This research material has been prepared by LPL Financial LLC.
To the extent you are receiving investment advice from a separately registered independent investment advisor, please note that LPL Financial LLC is not an affiliate of and makes no representation with respect to such entity.
Not FDIC or NCUA/NCUSIF Insured | No Bank or Credit Union Guarantee | May Lose Value | Not Guaranteed by Any Government Agency | Not a Bank/Credit Union Deposit.
RES 27698 0918 | For Public Use | Tracking #1-782078 (Exp. 10/19)