
Movin On Up (In Market Cap)
John Lynch Chief Investment Strategist, LPL Financial
Jeffrey Buchbinder, CFA Equity Strategist, LPL Financial
Key Takeaways
- Small cap stocks have performed well so far in 2019; however, we believe the environment is getting tougher.
- Large caps may take the baton and sustain leadership as small cap performance potentially enters a weaker phase.
- Small and large cap stocks may both deliver gains over the rest of the year, but we expect large caps to lead.
Large caps may be better positioned than small caps, given where we are in the business cycle. Small cap stocks have performed well so far in 2019, with the Russell 2000 Index, the most popular small cap benchmark, up 15.2% year to date compared with the 12.6% gain in the large cap S&P 500 Index. Small caps tend to do better when economic growth expectations improve and stocks broadly rally, which has been the case since late December 2018. However, we believe the environment is getting tougher for small caps, for reasons we discuss below.
Five Reasons to Favor Large Caps Over Small
We favor large cap stocks over small primarily for these five reasons:
- Age of the economic cycle. Large caps tend to do better late in the economic cycle. Small cap underperformance in 1989, 1990, the late 1990s, and 2007 are the most recent examples of late cycle small cap underperformance (based on the Russell 2000 and S&P 500). We don’t see a recession in 2019, but after 10 years of economic growth, we recognize the cycle is probably in its latter stages. Small caps tend to underperform large caps during economic recessions, which markets may increasingly begin to price in over the next year or two.
- Tightening financial conditions. As the cycle ages, tighter financial conditions may follow. Small cap companies depend more than larger companies on borrowing to fund growth and tend to have higher costs of capital. As a result, they tend to be more sensitive to credit market stresses. We do not see any major credit disruptions in the near term, but the odds have risen following three years of Federal Reserve (Fed) interest rate hikes. We expect only gradually rising market-based interest rates over the rest of 2019—the high end of our 10-year yield forecast is 3.25%—but if our forecast is too low, small caps may experience some incremental relative weakness.
- Trade policy. We continue to expect a trade deal with China in the near term. The latest news suggests that a framework for a deal has been largely mapped out and that President Trump and President Xi will meet over the next two to three months to seal the deal.
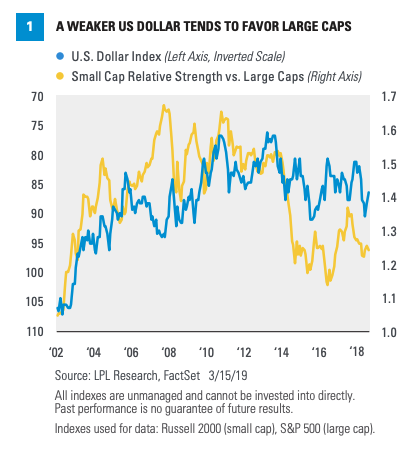
Large cap companies have bigger global footprints with more global supply chains, so the resolution of the trade conflict should benefit them more. Even if the deal unravels, small caps may not outperform large caps because the broad market would probably sell off. - The dollar. We expect the U.S. dollar to weaken in the medium to long term due to the twin deficits (budget and trade), which could be beneficial for
large cap stocks relative to theirsmall cap counterparts. Figure 1 shows small caps tend to do worse (and large caps better) when the dollar weakens, mostly because of their more domestic focus. Some factors that may limit any short-term dollar rallies include: 1) We think the Fed is done, or nearly done, raising interest rates; 2) Most of the U.S. dollars that companies were expected to repatriate from overseas at low tax rates following tax reform are here already; and 3) The expected gap in economic growth between the United States and the rest of the world may have stopped widening, as growth overseas may have bottomed, while the U.S. economy has only recently started to slow. - Fading impacts of tax reform. One of the reasons we liked small caps after the November 2016 election was that tax reform’s benefits to smaller companies were relatively greater. Because smaller companies tend to be more U.S.-focused, they paid higher tax rates. Once the U.S. corporate rate was brought down, those companies were able to save more on taxes. Larger, more global companies were paying lower average corporate tax rates before the December 2017 tax reform because they generated more profits in lower-tax countries.
Technical Insights
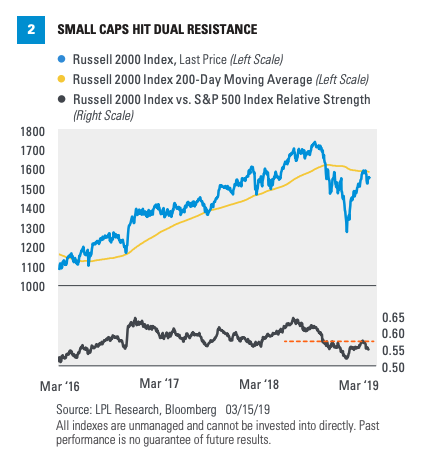
Small caps staged a furious rally to kick off 2019, with the Russell 2000 up nearly 18% year to date at the early March peak. Of course, small caps were down far more than large caps late last year, as the Russell 2000 lost 20.5% in the fourth quarter for the worst quarterly decline since the U.S. debt downgrade during the debt limit crisis in the third quarter of 2011.
What do we see now? Large caps may take the baton and sustain leadership as
Lastly, a relative strength chart (lower
Conclusion
Small caps may have a difficult time keeping up with large caps over the balance of the year, despite their strong start. As the economic cycle ages and financial conditions potentially tighten, we would expect better performance from
Thank you to Ryan Detrick and Scott Brown for their contributions to this report.
IMPORTANT DISCLOSURES
The opinions voiced in this material are for general information only and are not intended to provide specific advice or recommendations for any individual. To determine which investment(s) may be appropriate for you, consult your financial advisor prior to investing. All performance referenced is historical and is no guarantee of future results.
The economic forecasts set forth in this material may not develop as predicted.
Investing involves risks including possible loss of principal. No investment strategy or risk management technique can guarantee
All indexes are unmanaged and cannot be invested into directly. Unmanaged index returns do not reflect fees, expenses, or sales charges. Index performance is not indicative of the performance of any investment.
All information is believed to be from reliable sources; however LPL Financial makes no representation as to its completeness or accuracy.
INDEX DESCRIPTIONS
The Standard & Poor’s 500 Index is a capitalization-weighted index of 500 stocks designed to measure
The Russell 2000 Index measures the performance of the
DEFINITIONS
The 200-day moving average (MA) is a popular technical indicator that investors use to analyze price trends. It is the security or index’s average closing price over the last 200 days.
This research material has been prepared by LPL Financial LLC.
To the extent you are receiving investment advice from a separately registered independent investment advisor, please note that LPL Financial LLC is not an affiliate of and makes no representation with respect to such entity.
Not FDIC or NCUA/NCUSIF Insured | No Bank or Credit Union Guarantee | May Lose Value | Not Guaranteed by Any Government Agency | Not a Bank/Credit Union Deposit
RES 92317 0319 | For Public Use | Tracking #1-833004 (Exp. 03/20)