
LOWER VALUATIONS OFFER LONG-TERM OPPORTUNITY
John Lynch Chief Investment Strategist, LPL Financial
Jeffrey Buchbinder CFA Equity Strategist, LPL Financial
KEY TAKEAWAYS
- A significant drop in stock market valuations may portend above-average stock market performance, based on history.
- Stocks also look attractively valued relative to bonds based on a comparison of earnings yields.
- Though it is difficult to think long-term during volatile market environments, low valuations have been closely tied to future positive long-term stock performance.
This week, we look at stock valuations to try to gauge the potential opportunity for stocks. Amid the dizzying volatility and new cycle that investors have had to deal with lately, it can be difficult for many investors to take a step back and see beyond the daily headlines. We try to do that this week by focusing on what lower stock market valuations relative to corporate profits may signal for stock market performace over the next year and beyond.
LOWER VALUATIONS PROVIDE OPPORTUNITY
The latest reduction in stock market valuations has been dramatic. While the all-time high for the S&P 500 Index was set on September 20, 2018, the highest point for stock valuations—based on the price-to-earnings ratio (PE) for the index (using FactSet consensus earnings for the next 12 months)—actually occurred in January 2018. This PE measure (referred to as forward PE) is a measure of how much market participants are willing to pay for expected earnings per share over the next year for S&P 500 constituents.
Investors are willing to pay a lot less now than there were a year ago, as the valuation reduction has been significant. From January 22, 2018, through the recent low on December 24, the S&P 500 PE fell about five points (18.4 to 13.5). Since 1995, a drop that big or bigger within a one-year time frame has occurred only four times, during either the 2001-2002 or 2008 bear markets. Over the one year following those declines, the S&P 500 returned an average of 10% (median 12.7%). The current environment looks much better to us than either of those periods, suggesting investors may be getting a bear-market discount for better-than-bear-market earnings.
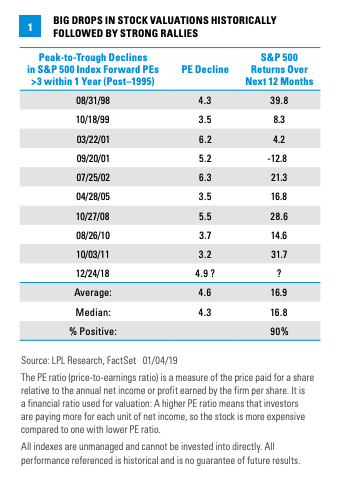
A different cut at this is even more compelling. Over one-year periods, if the PE drops by at least 3 points, the subsequent average return is nearly 17%, with gains in eight out of nine observations [Figure 1]. The S&P 500 currently meets this criterion even after Friday’s big rally, suggesting stocks can generate above-average returns in the coming year.
STOCKS LOOK CHEAP VERSUS BONDS
Another way to gauge stock valuations is by comparing the earnings generated by stocks with bond yields, which are essentially earnings generated by bonds. We do this by comparing the earnings yield for the S&P 500 Index (S&P 500 earnings per share divided by the index price level) with the yield on the 10-year Treasury.
This statistic, referred to as the equity risk premium (ERP), has average about 0.5% over the past six decades. However, the ERP has climbed recently as both stock valuations and bond yields have fallen, bringing it to a historically high level at 3.4%.
Historically, a higher ERP has pointed to better future stock market performance. Since 1960, when the gap between the earnigns yield and Treasury yields has been above 3% (as it is now), the S&P 500 has gained 12.4% on average over the following 12 months [Figure 2]. The biggest returns have occurred when the equity risk premium has been above 2%, which has largely been the case since the end of 2016.

VALUATIONS ARE GOOD PREDICTORS OF LONG-TERM PERFORMANCE
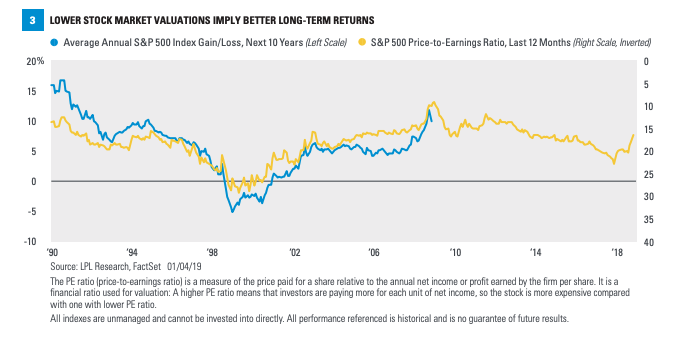
It’s tough to think long-term, when markets are this volatile and stocks, are down, but that is probably the best time to do so. Why? Because the relationship between valuations and long-term stock market performance is quite strong, as shown in Figure 3. In the chart, we show that a lower PE (with scale inverted to more clearly illustrate the relationship) has historically translated into better future average annual performance for the S&P 500 over the following 10 years. We use trailing 12 months earnings for this PE calculation for the longer available data series.
Based on this historical relationship, at the current S&P 500 PE of 15-16, forecasted annual price gains would be in the 8-9% range before factoring in dividends. On September 20, a PE of 19 implied a return of around 5%. In other words, valuations suggest U.S. equities may be attractive long-term opportunity. It’s hard to think long term when markets are volatile, but that ability can be a big advantage for individual investors.
CONCLUSION
We continue to focus on a generally favorable fundamental backdrop, bolstered by the strong jobs report on Friday, while improved stock market valuations may support solid longer-term returns based on history. We believe the outlook for economic and corporate profit growth is simply better than stocks are pricing in, though we acknowledge there are risks among many potential positive developments.
To be sure, fears of a recession could lead to a self-fulfilling prophecy. Worries about the future could prevent companies from investing or consumers from spending in 2019. Trade tensions could re-escalate. Lower asset values may drag on consumer sentiment. Yet we believe that outcome is unlikely, given the fundamental foundation supporting growth in the economy and corporate profits, along with a Federal Reserve that appears more flexible than previously feared and improving prospects for a trade deal with China.
We understand it can be difficult to focus on the long-term during periods of market volatility, but analysis outlined in this report suggests that it can be important for investors to do so.
IMPORTANT DISCLOSURES
The opinions voiced in this material are for general information only and are not intended to provide specific advice or recommendations for any individual. To determine which investment(s) may be appropriate for you, consult your financial advisor prior to investing. All performance referenced is historical and is no guarantee of future results.
The economic forecasts set forth in the presentation may not develop as predicted and there can be no guarantee that strategies promoted will be successful.
Investing in stock includes numerous specific risks including: the fluctuation of dividend, loss of principal, and potential liquidity of the investment in a falling market.
The payment of dividends is not guaranteed. Companies may reduce or eliminate the payment of dividends at any given time.
Bonds are subject to market and interest rate risk if sold prior to maturity. Bond values will decline as interest rates rise and bonds are subject to availability and change in price. Bond yields are subject to change. Certain call or special redemption features may exist which could impact yield.
All indexes are unmanaged and cannot be invested into directly. Unmanaged index returns do not reflect fees, expenses, or sales charges. Index performance is not indicative of the performance of any investment.
INDEX DESCRIPTIONS
The Standard & Poor’s 500 Index is a capitalization-weighted index of 500 stocks designed to measure performance of the broad domestic economy through changes in the aggregate market value of 500 stocks representing all major industries.
This research material has been prepared by LPL Financial LLC.
To the extent you are receiving investment advice from a separately registered independent investment advisor, please note that LPL Financial LLC is not an affiliate of and makes no representation with respect to such entity.
Not FDIC or NCUA/NCUSIF Insured | No Bank or Credit Union Guarantee | May Lose Value | Not Guaranteed by Any Government Agency | Not a Bank/Credit Union Deposit
RES 62697 0119 | For Public Use | Tracking #1-808747 (Exp. 01/20)