
The following question was brought up recently: What could the extreme outperformance from utilities mean for both utilities and the S&P 500 for the rest of the year? Looking at 2016, the Dow Jones Utility Average was up 13.3% for the first four months of the year, versus a 1.0% gain for the S&P 500 Index. The consensus thinking is that seeing defensive areas like utilities outperform at such a wide margin could suggest upcoming weakness overall for equities. Historically, in healthy bull markets you want to see leadership come from areas such as technology and small caps, not a defensive sector like utilities.
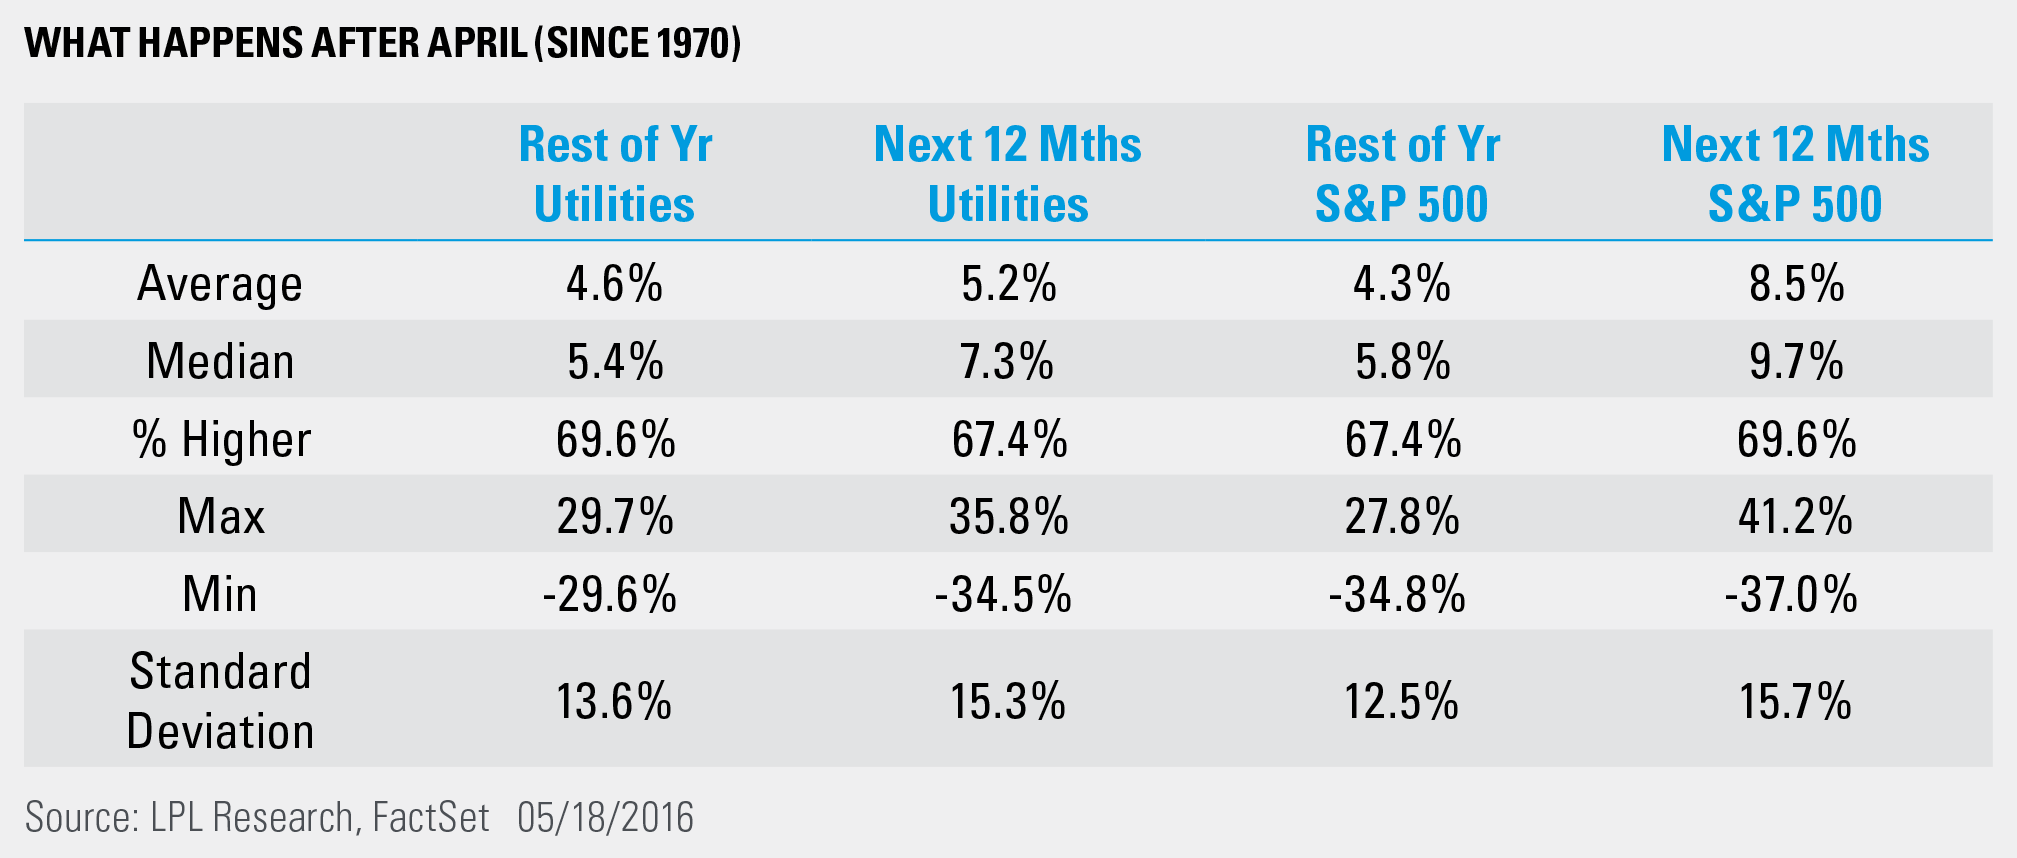
Going back to 1970, the Dow Jones Utility Average gained more than 8% during the first four months of the year six other times. The rest of the year actually saw an average return of 6.7% for utilities, higher than the average rest of the year of 4.6%. In other words, strength equals strength.
Turning to the S&P 500 Index, the last time utilities were up this much to start a year was 2013. The S&P 500 gained nearly 16% for the rest of that year, so clearly this potential warning sign didn’t work that time. Looking at all the data, the S&P 500 returned slightly more than the average rest of the year, at 4.8% versus 4.3%.
What is also worth noting is the S&P 500’s standard deviation for the rest of the year after utilities are strong is lower than average. So returns are better for the S&P 500 and there is less volatility—that probably isn’t what most people expect when utilities are strong to kick off the year. Now, be aware that the 12-month returns on the S&P 500 after strong utility performance are rather weak, up only 4.0% on average—nearly half the average 12-month gain since 1970. This leads to the question, does this warning sign just take longer to play out?

Strength in utilities to start a year does not seem to be the major warning sign for equities as some have suggested. At the same time, there have only been six occurrences of strong utilities to start the year going back to 1970; thus, the sample size is very small and this can distort things. We continue to expect mid-single-digit gains for equities in 2016,* and that volatility will remain high as well; this study does little to change our views.
IMPORTANT DISCLOSURES
*Historically since WWII, the average annual gain on stocks has been 7-9%. Thus, our forecast is roughly in-line with average stock market growth. We forecast a mid-single digit gain, including dividends, for U.S. stocks in 2016 as measured by the S&P 500. This gain is derived from earnings per share (EPS) for S&P 500 companies assuming mid-to-high-single-digit earnings gains, and a largely stable price-to-earnings ratio. Earnings gains are supported by our expectation of improved global economic growth and stable profit margins in 2016.
Past performance is no guarantee of future results. All indexes are unmanaged and cannot be invested into directly. Unmanaged index returns do not reflect fees, expenses, or sales charges. Index performance is not indicative of the performance of any investment.
The economic forecasts set forth in the presentation may not develop as predicted.
The opinions voiced in this material are for general information only and are not intended to provide or be construed as providing specific investment advice or recommendations for any individual security.
Stock investing involves risk including loss of principal.
The S&P 500 Index is a capitalization-weighted index of 500 stocks designed to measure performance of the broad domestic economy through changes in the aggregate market value of 500 stocks representing all major industries.
This research material has been prepared by LPL Financial LLC.
The Dow Jones Utility Average is a price-weighted average of 15 utility stocks traded in the United States. The DJUA was started back in 1929.
To the extent you are receiving investment advice from a separately registered independent investment advisor, please note that LPL Financial LLC is not an affiliate of and makes no representation with respect to such entity.
Not FDIC/NCUA Insured | Not Bank/Credit Union Guaranteed | May Lose Value | Not Guaranteed by any Government Agency | Not a Bank/Credit Union Deposit
Securities and Advisory services offered through LPL Financial LLC, a Registered Investment Advisor
Member FINRA/SIPC
Tracking # 1-498920 (Exp. 05/17)