
KEY TAKEAWAYS
- High-yield bond price declines have been exacerbated by rising default expectations, which we believe may have gone too far.
- The fear prevalent in the high-yield market may have created a unique opportunity for those who can tolerate near-term volatility until fundamentals return to the forefront.
Click here to download a PDF of this report.
TOUGH START FOR HIGH-YIELD
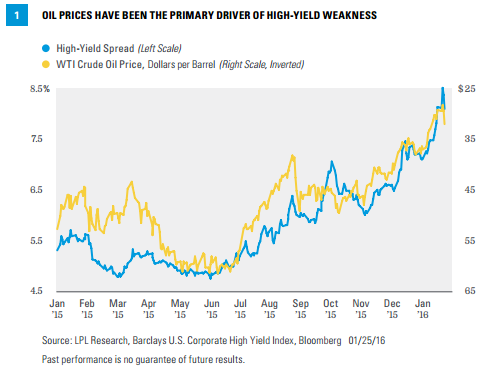
Additional oil price declines, oil-related default fears, growth concerns, and a general aversion to lower-quality bonds have combined to pressure high-yield bonds at the start of 2016. However, justified or not, oil continues to be the primary driver of high-yield performance. The price of oil and the average yield advantage, or spread, of high-yield bonds to comparable Treasury bonds have moved in tandem, especially since the final quarter of 2015 [Figure 1].
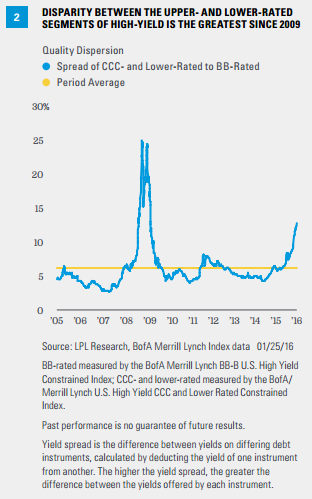
Investors are demanding the largest risk premiums for the lowest-rated segments of the high-yield bond market since early 2009. This pattern emerged in the fourth quarter of 2015 but has continued into the new year, with spreads on CCC- and lower-rated bonds to BB-rated bonds continuing to widen in 2016 [Figure 2].
BRACING FOR THE WORST
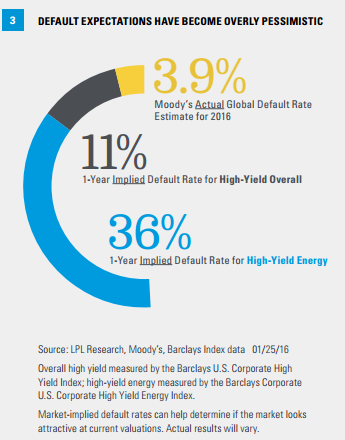
High-yield bond price declines have been exacerbated by rising default expectations, which we believe may have gone too far. The fundamental footing of high-yield bonds has not changed materially but market default expectations have priced in a lot of bad news [Figure 3]. Using current Treasury yields and high-yield bond prices and yields, we can construct market-implied default expectations. Based on current levels, the market-implied default rate for the overall high-yield market is 11% for one year, and a cumulative 43% default rate over five years.
Perhaps more startling are the implied default expectations for high-yield energy: 36% defaults over a one-year time frame and a cumulative 89% default rate over five years. Default expectations like these paint an overly dire picture and would likely need to be justified by a recession. In contrast, Moody’s has forecast a 3.9% global default rate by the end of 2016. In our view, a greater rise to 4.0-4.5% is plausible but would still be well shy of the 11% currently implied by market pricing.
LEADING INDICATOR ON TAP
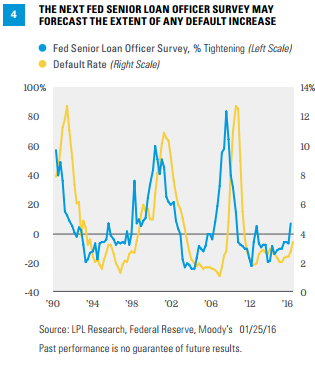
One of the better leading indicators of defaults and high-yield bond performance, the quarterly Federal Reserve Senior Loan Officer Survey (FSLO), will be released on Monday, February 1, 2016. The FSLO shows the percentage of banks either tightening or loosening lending standards and has been a very good leading indicator of defaults [Figure 4]. When lending standards become too tight, credit to the economy may be choked off and defaults increase. Conversely, loose or moderate lending standards help limit defaults. As the modified adage goes, “a rolling loan gathers no loss.”
The previous release in early November 2015 showed a slight tightening by banks, which partially explains the increase in yield spreads. Standards would have to tighten further to help justify current high-yield valuations, however. Therefore, the upcoming quarterly release of the FSLO on February 1 could serve to either partially justify the default fears priced into the market, should tightening accelerate, or confirm that spreads may have increased beyond levels justified by fundamentals.
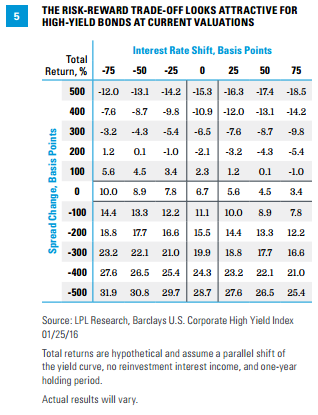
SCENARIO ANALYSIS
Scenario analysis can help illustrate the potential range of outcomes for high-yield in the coming year given the current cheaper valuations. As shown in Figure 5, assuming no change in valuations (i.e., yield spreads) and a modest 0.5% (50 basis points) increase in interest rates, the hypothetical one-year forward return for high-yield is a modest 4.5%. If interest rates remain at their current level and yield spreads do not change, high-yield would have a total return of 6.7%. On the other hand, a 1.0% (100 basis points) spread tightening (which still would not reverse the increase in yield spreads) translates to an expected 11.1% return in the next year, a significant increase.
In this hypothetical illustration, the high-yield risk-reward looks attractive.
CONCLUSION
The broad fundamental picture of the high-yield market remains relatively healthy in our view. Financial leverage among the average issuer has increased, which is a negative, but this is offset by interest coverage ratios that remain notably higher than prior periods of major default episodes that began in 2000 and 2007. Interest coverage is the number of times a company can cover its interest expense with its earnings before interest and taxes.
The primary risk for high-yield bonds remains a recession, in which case yield spreads may widen further, limiting potential returns. Continued weakness on negative sentiment remains another risk and could pressure prices lower due to illiquid trading conditions that accompany volatile periods. We don’t believe, however, that the U.S. is entering a recession, based upon our analysis of economic data, and the fear prevalent in the market may have created a unique opportunity for those who can tolerate near-term volatility until fundamentals return to the forefront.
IMPORTANT DISCLOSURES
The opinions voiced in this material are for general information only and are not intended to provide specific advice or recommendations for any individual. To determine which investment(s) may be appropriate for you, consult your financial advisor prior to investing. All performance reference is historical and is no guarantee of future results. All indexes are unmanaged and cannot be invested into directly.
The economic forecasts set forth in the presentation may not develop as predicted and there can be no guarantee that strategies promoted will be successful.
Bonds are subject to market and interest rate risk if sold prior to maturity. Bond values and yields will decline as interest rates rise, and bonds are subject to availability and change in price.
High-yield/junk bonds are not investment-grade securities, involve substantial risks, and generally should be part of the diversified portfolio of sophisticated investors.
Government bonds and Treasury bills are guaranteed by the U.S. government as to the timely payment of principal and interest and, if held to maturity, offer a fixed rate of return and fixed principal value. However, the value of fund shares is not guaranteed and will fluctuate.
Corporate bonds are considered higher risk than government bonds but normally offer a higher yield and are subject to market, interest rate, and credit risk as well as additional risks based on the quality of issuer coupon rate, price, yield, maturity, and redemption features.
DEFINITIONS
Credit quality is one of the principal criteria for judging the investment quality of a bond or bond mutual fund. As the term implies, credit quality informs investors of a bond or bond portfolio’s credit worthiness, or risk of default.
Moody’s is an independent, unaffiliated research company that rates fixed income securities. Moody’s assigns ratings on the basis of risk and the borrower’s ability to make interest payments.
INDEX DESCRIPTIONS
The Barclays U.S. Corporate High Yield Index measures the market of USD-denominated, noninvestment-grade, fixed-rate, taxable corporate bonds. Securities are classified as high yield if the middle rating of Moody’s, Fitch, and S&P is Ba1/BB+/BB+ or below, excluding emerging market debt.
The Barclays U.S. Corporate High Yield Energy Index covers the universe of fixed rate, non-investment grade debt. Eurobonds and debt issues from countries designated as emerging markets (sovereign rating of Baa1/BBB+/BBB+ and below using the middle of Moody’s, S&P, and Fitch) are excluded, but Canadian and global bonds (SEC registered) of issuers in non-EMG countries are included. Original issue zeroes, step-up coupon structures, 144-As and pay-in-kind bonds (PIKs, as of October 1, 2009) are also included.
The BofA Merrill Lynch BB-B U.S. High Yield Constrained Index contains all securities in the BofA Merrill Lynch US High Yield Index rated BB+ through B- by S&P (or equivalent as rated by Moody’s or Fitch), but caps issuer exposure at 2%. Index constituents are capitalization-weighted, based on their current amount outstanding, provided the total allocation to an individual issuer does not exceed 2%.
BofA/Merrill Lynch U.S. High Yield CCC and Lower Rated Constrained Index represents the effective yield of the BofA Merrill Lynch U.S. Corporate C Index, a subset of the BofA Merrill Lynch U.S. High Yield Master II Index tracking the performance of U.S. dollar-denominated, below-investment-grade rated corporate debt publically issued in the U.S. domestic market. This subset includes all securities with a given investment-grade rating CCC or below. When the last calendar day of the month takes place on the weekend, weekend observations will occur as a result of month ending accrued interest adjustments.
This research material has been prepared by LPL Financial LLC.
To the extent you are receiving investment advice from a separately registered independent investment advisor, please note that LPL Financial is not an affiliate of and makes no representation with respect to such entity.
Not FDIC or NCUA/NCUSIF Insured | No Bank or Credit Union Guarantee | May Lose Value | Not Guaranteed by Any Government Agency | Not a Bank/Credit Union Deposit
Tracking #1-461513 (Exp. 01/17)