
Happy Valentine’s Day everyone! With the S&P 500 Index up 9.8% for the year as of yesterday, this is its best start up to this point since 1991. So should investors love to see this much green this early in the year, or should they be leery they might be heartbroken down the road?
An old adage on Wall Street suggests, “As goes January, so goes the year.” With stocks having posted their best January in more than 30 years, it’s time to take a closer look at the January barometer, first discussed in 1972 by Yale Hirsh of the Stock Trader’s Almanac. Simply put, if the first month of the year is green, it bodes well for the rest of the year (and vice versa).
Let’s get one thing straight—this didn’t work last year. The S&P 500 was up more than 5% in January of 2018, and it closed the year in the red. Nonetheless, the January barometer has a strong track record, and one we shouldn’t ignore.
The numbers confirm that when the S&P 500 has been green in January, the rest of the year (final 11 months) has been up 11.7% on average, well above the overall average return of 7.6% for the final 11 months of the year. However, when that first month was red, the final 11 months were up only 1.2% on average. According to LPL Research Senior Market Strategist Ryan Detrick, “The January barometer isn’t perfect, but it does have a pretty solid track record. Now where things really get interesting is when that first month was up more than 7% (like in 2019), the return over the final 11 months actually became stronger.”

Of course, we don’t suggest investing based simply on what the first month does, but with a more accommodative Federal Reserve, fiscal policy still flowing, and likely continued better-than-expected corporate earnings growth, this is yet another sign that 2019 may see a continuation of the bull market, as we outlined previously in our Outlook 2019.
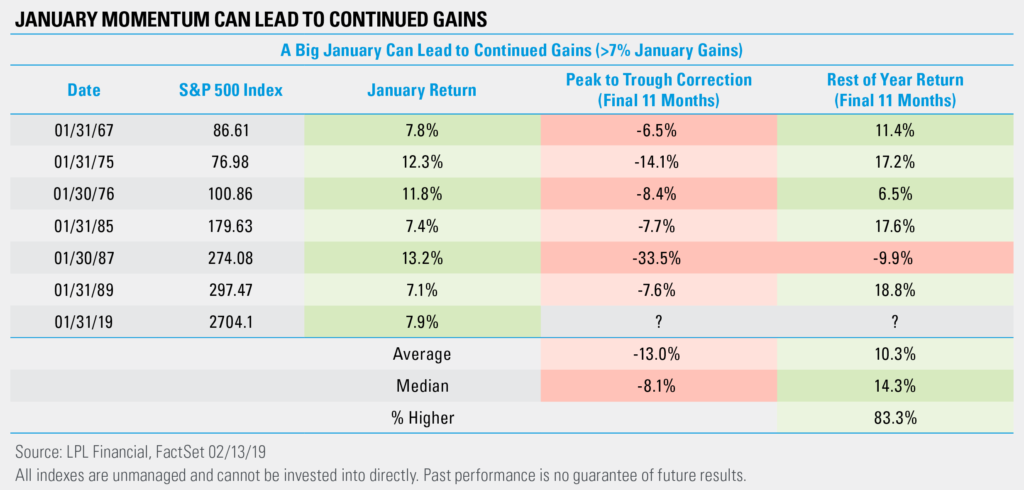
In all the instances when the S&P 500 was up more than 7% at the end of January, the rest of the year gained five out of six times, with only 1987 negative. Still, a 10.3% return over the final 11 months implies we’d see new highs before 2019 is over. Last, be open to a pullback, as a median correction of 8.1% has happened in the past after super strong starts to the year.
IMPORTANT DISCLOSURES
The opinions voiced in this material are for general information only and are not intended to provide specific advice or recommendations for any individual security. To determine which investment(s) may be appropriate for you, consult your financial advisor prior to investing. The economic forecasts set forth in this material may not develop as predicted.
All indexes are unmanaged and cannot be invested into directly. Unmanaged index returns do not reflect fees, expenses, or sales charges. Index performance is not indicative of the performance of any investment. All performance referenced is historical and is no guarantee of future results.
Investing involves risks including possible loss of principal. No investment strategy or risk management technique can guarantee return or eliminate risk in all market environments.
This research material has been prepared by LPL Financial LLC.
To the extent you are receiving investment advice from a separately registered independent investment advisor, please note that LPL Financial LLC is not an affiliate of and makes no representation with respect to such entity.
The investment products sold through LPL Financial are not insured deposits and are not FDIC/NCUA insured. These products are not Bank/Credit Union obligations and are not endorsed, recommended or guaranteed by any Bank/Credit Union or any government agency. The value of the investment may fluctuate, the return on the investment is not guaranteed, and loss of principal is possible.
For Public Use | Tracking # 1-822714 (Exp. 02/20)