
OVERVIEW
The Search for Income publication is a quarterly guide to our top ideas for income producing securities and strategies. This publication offers active and passive income suggestions from our current mutual fund recommended list, along with suggested exchange-traded funds (ETF). Many of the asset classes/sectors can be used individually or in a diversified portfolio, and several are currently employed in our model portfolios.
Click here to download a PDF of this report.
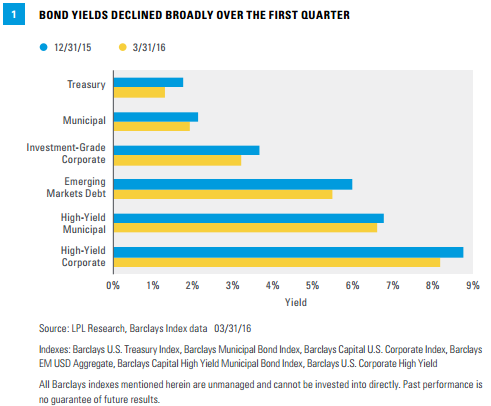
Interest rates declined across the majority of the maturity spectrum during the first quarter of 2016 amid volatility in global equity markets [Figure 1]. The quarter had two distinct phases: during the first half of the quarter, equity markets and economically sensitive bond sectors sold off on diminished risk appetite, led lower by high-yield and bank loans. The second half of the quarter saw stocks reverse course, and lower-quality bonds rallied amid investor belief that global growth concerns and implied default rates had become overly pessimistic.
Longer-dated fixed income outperformed shorter-dated along the maturity spectrum and more economically sensitive, lower-rated sectors tended to outperform higher-quality sectors.
Yields on high-yield bonds increased to an over four-year high mid-quarter, driven by continued oil price weakness and concerns over related defaults.
That sentiment reversed mid-February, as oil prices began to climb and opportunistic investors stepped into the market, believing implied default rates in the market had overshot reasonable levels. High-yield bonds continue to be supported by stable credit quality metrics and a relatively low-default environment, though defaults are starting to rise slowly.
A pullback in the U.S. dollar and an increase in the price of oil during the quarter helped reduce investor default fears over high-yield bond issuers. Outside the energy sector, we expect defaults to remain limited.
Yields declined in almost all bond market sectors during the quarter, lifting already high valuations and bringing yields back near historical lows, suggesting a low-return environment will likely persist for suitable income-seeking investors.
Among high-quality bonds, we believe municipal bonds may represent a slightly better longer-term opportunity and taxable equivalent yields remain compelling for suitable income-seeking investors. Municipal bond valuations cheapened over the first quarter of 2016 as municipal yields could not keep pace with the decline in Treasury yields.
In general, we prefer to look domestically for income-generating investments given the more favorable economic backdrop, which should continue to support credit quality. Currently, our best ideas for potential income generation are:
- High-yield bonds (taxable and tax-free)
- Bank loans (floating rate funds)
- Preferred stocks
- Investment-grade corporate bonds (intermediate and long term)
- Emerging markets debt (EMD)
High-yield bonds (taxable) remain a way to potentially generate above-average interest income. The high-yield sector’s average yield decreased to 8.2% over the first quarter, comprising a 6.9% advantage over comparable Treasuries as of March 31, 2016, slightly below that of last quarter (7.0% as of December 31, 2015) and above the 20-year average of 5.8%.
Bank loans had a volatile first quarter, but exhibited less volatility than high-yield bonds as has historically been the case. Bank loans may continue to be an option for more conservative clients, who seek yield while simultaneously mitigating interest rate risk.
Like the broader bond market, the possibility of rising interest rates poses a risk for preferred stocks, but the added yield and good underlying credit quality should help. Bank credit quality trends remain relatively stable despite fourth quarter 2015 data that show a slight decline in banks’ equityto-total-assets ratio. The equity-to-assets ratio is only slightly off all-time highs touched in the third quarter, indicating that leverage is still low relative to history.
Investment-grade corporate bond prices were aided by broad high-quality bond market strength during the first quarter of 2016 and modestly outperformed Treasuries. Valuations richened over the quarter, with the average yield advantage to Treasuries down slightly during the first quarter of 2016 to 1.6%, above the long-term average of 1.4%. Investment-grade corporate bonds remain an income-producing option among high-quality domestic bonds, especially considering the low yields on other high-grade bond sectors, such as Treasuries and mortgage-backed securities (MBS). The high-quality nature of investment-grade corporate bonds makes them more sensitive to rising interest rates, however.
Emerging markets debt (EMD), buoyed by the stabilization in the price of oil during the quarter and the renewed appetite for risk, also enjoyed a strong first quarter. Valuations richened slightly during the first quarter of 2016, with the average yield spread decreasing from 4.1% to 4.0%.
The income-focused theme within the Model Wealth Portfolios (MWP), which combines multiple asset classes and sectors, provides exposure to several of these ideas. These portfolios’ goals are to seek excess total return and, secondarily, to pursue higher overall yields than the LPL Research blended benchmarks.
FAVORITE SECTOR/ASSET CLASS IDEAS
High-Yield Bonds (Taxable and Tax-Free): Our Preferred Asset Class Within Fixed Income A mid-quarter rekindling of investor risk appetite was the main driver of the strong first quarter for high-yield bonds. Stabilization in the price of oil, which rose 3% during the first quarter, provided support for high-yield energy, fueling the strength in the overall high-yield market. High-yield rallied to a 3.4% return during the first quarter.
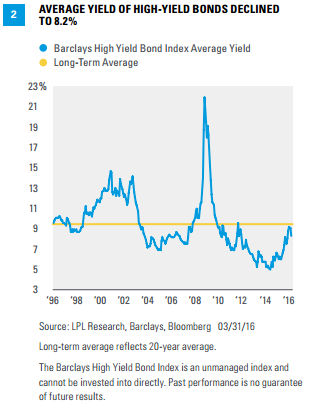
The average yield of the high-yield bond market, based on Barclays High Yield Index, reached a new four-year high during the first quarter of 2016, rising above 10.0% for the first time since 2011. That yield began to decline mid-quarter to end at 8.2%. Although elevated relative to recent history, this yield is still below the long-term average of 9.4% [Figure 2].
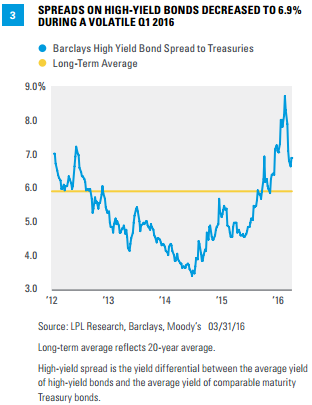
The average yield advantage of high-yield bonds to Treasuries fell to 6.9% as of March 31, 2016, down slightly from 7.0% at the end of 2015 [Figure 3]. This yield spread is still above the long-term average of 5.8%, but may represent fair value given expectations for rising defaults.
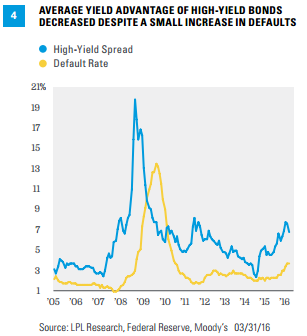
Energy sector defaults are increasing, and will likely remain a risk throughout 2016; however, the fundamental backdrop for high-yield remains stable outside of energy and metals and mining sectors. Credit quality remains firm and defaults are on the rise but cheaper high-yield bond valuations have largely priced in an increase [Figure 4]. The global high-yield default rate notched up to 3.8% over the first quarter of 2016, according to Moody’s.
For diversification purposes, we recommend investors use a mutual fund or exchange-traded product (ETP) for exposure to this asset class.
Suitable investors, regardless of tax bracket, may wish to consider municipal (tax-free) high-yield bonds. The average yield of tax-free high-yield bonds is 6.6%, according to the Barclays High Yield Municipal Index (as of March 31, 2016), lower than that of the taxable high-yield market. However, this translates to a taxable equivalent yield of 10.8% (assuming a 39.6% tax rate), which becomes more compelling. Due to the diversity of the municipal high-yield market, many securities may not yield this much, however.
The average yield advantage of high-yield municipal bonds to AAA-rated municipal bonds ended the first quarter of 2016 at 4.3%, equal to the level seen at the end of 2015. The average yield spread remains slightly above the four-year average but is heavily influenced by volatile Puerto Rican issues. The greater yield is not without risks. Municipal high-yield bonds have longer maturities, and therefore, tend to be more interest rate sensitive than their taxable counterparts, a risk worth noting should interest rates rise. Interest rate sensitivity was one of the primary drivers of high-yield municipal bond weakness in 2013 but a strong positive driver in 2014.
Credit quality trends, like those of the taxable market, are largely supportive of the sector in our view. According to the Municipal Securities Rulemaking Board (MSRB) and Municipal Market Advisors data, the number of defaulted municipal issuers fell again in 2015, down from the already low level witnessed in 2014. Thus far in 2016, the municipal market is on pace for an even lower annualized number of defaults than in 2015. In general, municipal defaults remain isolated and have been concentrated in more speculative sectors.
Please be aware that the vast majority of tax-free, high-yield funds generate income that is subject to alternative minimum tax (AMT). Again, we recommend investors use a fund to gain exposure. Please contact the fund or ETP companies directly to obtain a copy of the prospectus for the percentage of income subject to AMT.
Floating Rate Bank Loans: More Conservative Approach to High-Yield
Companies rated below investment grade issue loans (debt) via banks for their short-term funding needs (hence the name “bank loans”). Most bank loans are senior secured debt, as the companies generally pledge specific tangible assets for the loan, ranking them above traditional bonds and equities in a corporation’s capital structure.
These securities historically pay a higher yield than short-term securities (generally 1.0–4.0% above Libor, the London interbank offered rate) and seek to provide protection against rising interest rates by adjusting interest payments at regular intervals to reflect changes in a short-term rate (usually three-month Libor). Unlike traditional fixed-rate bonds (where rising interest rates hurt their prices), when rates rise, bank loans pay a higher rate and therefore their prices do not necessarily fall; but, conversely, they generally do not benefit from rising prices associated with falling interest rates.
With an above-average yield, bank loans have been an income alternative that help balance the need for income generation with interest rate risk. Bank loans were one of the least impacted sectors during the taper tantrum bond market sell-off of May and June 2013 due to their lack of interest rate sensitivity. Conversely, the sector did not benefit from falling interest rates during the first half of the first quarter of 2016.
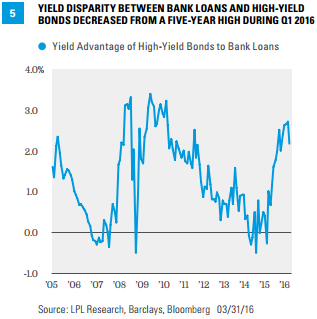
The yield disparity between high-yield bonds and bank loans decreased during the first quarter to 2.2%, down from the 2.6% to end 2015, though still above the 10-year average of 1.3% [Figure 5]. At the margin, this makes bank loans more attractive relative to high-yield compared to the end of 2015, but in today’s low interest rate environment, the 2.2% yield advantage of high-yield is significant. Additionally, if interest rates remain range bound, the appeal of bank loans will be limited, as bank loans show their true value in rising interest rate environments. However, bank loans have historically exhibited much less volatility than high-yield bonds, and therefore, may be a good option for more conservative investors. The lower volatility of bank loans was evident during the equity market weakness of the first six weeks of 2016 when bank loan prices held up better than high-yield. During the second half of the first quarter, however, bank loans underperformed high-yield.
Like high-yield bonds, credit quality metrics for bank loans are stable and defaults, although rising, are rising more slowly compared to high-yield bonds. Exposure to the energy sector in the bank loan market is much less than in the high-yield market and comprises just 5% of the market according to Standard & Poor’s data.
Preferred Stocks: Potentially Attractive Yields
Preferred stocks are fixed income securities that income-seeking investors may want to consider. The financial sector, which comprises roughly 80% of all preferred issuers, has benefited from stable to improving bank credit quality metrics. Financial regulation may limit growth opportunities but increased capital requirements help reduce bondholder risks.
We still believe the sector can be used as a potential income generator in today’s fixed income environment, but caution is warranted. Average yields of preferred stocks decreased to 5.2% over the first quarter of 2016, down from 5.5% at the end of 2015. This yield level is misleading, however, as very low interest rates have increased redemption risk for preferred stocks, driving down the yield-to-call* in the sector. Whether many preferred securities will be redeemed is unknown at this point and will take time to unfold. Due to the varied nature of the preferred market, the yield advantage to comparable Treasuries may vary depending on the specific investment product.
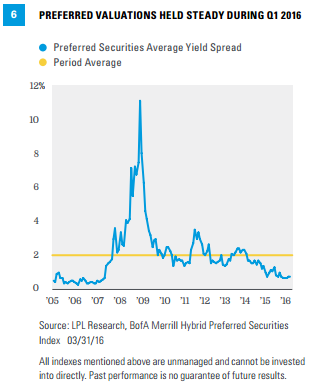
The average yield advantage to Treasuries remained at 0.7% over the first quarter of 2016, maintaining the valuations seen at the end of 2015. Yield spreads remain below the historic norm of 1.9% [Figure 6]. This spread is more reflective of a spread to call and understates the potential yield advantage since we believe many issues will not be redeemed early, however. This spread accounts for significant redemption risk, as the bulk of preferred securities are redeemable. Given the favorable economic backdrop and improved credit quality of financials, we believe the sector can be used as an income option.
Investment-Grade Corporate Bonds: Historically Stable in Slow-Growth Environment
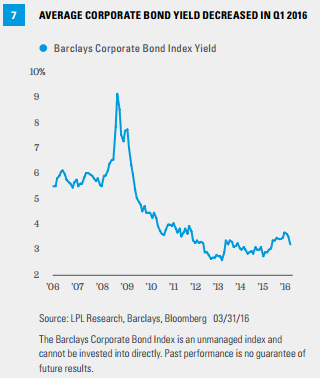
Investment-grade corporate bond yields remain low by historical comparison, but the asset class continues to be an income-producing option for investors seeking higher-quality bonds [Figure 7]. As of March 31, 2016, the average yield of investment-grade corporate bonds was 3.2%, below the 3.7% yield at the end of 2015.
For some investors, such yield levels may not be exciting, but yields vary depending on the specific investment used. We believe investmentgrade corporate bonds can still be used as an income-producing option in fixed income markets, considering historically low Treasury and MBS yields. Among higher-quality bond options, we believe investment-grade corporate bonds provide a better combination of yield for a given level of interest rate risk.
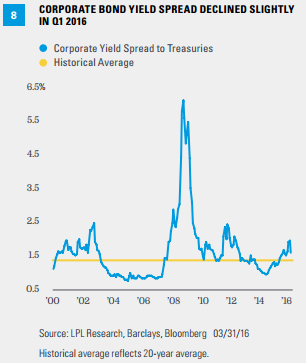
As of March 31, 2016, the average investment-grade corporate bond yield spread to Treasuries was 1.6%, above the historical average of 1.4% and just below the 1.7% level seen at the end of 2015 [Figure 8]. The ability of corporations to repay debt obligations in a timely manner (credit quality) has plateaued but remains strong. Favorable corporate credit quality metrics should support stable yield spreads.
Emerging Markets Debt: May Benefit from Emerging Markets Growth
Lingering concerns over slowing global growth and currency weakness continued to weigh on emerging markets debt (EMD) during the first quarter of 2016, and were especially pronounced in the first six weeks of 2016. During the second half of the quarter, EMD rallied with other economically sensitive sectors, as concerns over slowing global growth may have become overly dire. The net result was a slight richening in valuations.
Over the first quarter of 2016, the average yield advantage of EMD above comparable Treasuries decreased from 4.1% to 4.0% as of March 31, 2016 [Figure 9]. A 4% yield spread has represented good value over the last five years, as yield spreads have rarely stayed above that level.
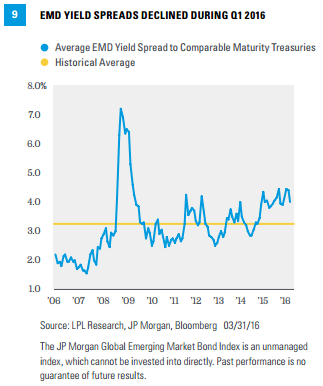
Fair valuations should help buffer the sector from future episodes of growth concerns. Valuations have richened further to start the second quarter, with the yield advantage to Treasuries decreasing to 3.9% as of April 18, 2016.
The average EMD yield of 5.1%, though still below its 10-year average of 6.1%, stands out in a lowyield world. The challenging environment for bonds overall may provide headwinds, as might lingering concerns over the pace of economic growth in China and concerns over commodity-related weakness.
Despite a slowdown, we still expect most EM countries to exhibit potentially higher growth rates than their developed country counterparts, which should help support credit quality over a longer horizon. Additionally, an average yield spread of 4.0% may provide a buffer to potential risks. Local currency EMD, however, may be more volatile than dollar-denominated EMD, as has historically been the case, due to currency volatility. We believe EMD can still be used for suitable income-seeking and total return-oriented investors.
IMPORTANT DISCLOSURES
The MWP portfolios are exposed to mutual funds and ETPs.
Investors should consider the investment objectives, risks, charges, and expenses of the investment company carefully before investing. The prospectus, and if available, the summary prospectus, contains this and other information about the investment company. You can obtain a prospectus from your financial representative. Read carefully before investing.
Investing in mutual funds, or exchange-traded funds (ETF) involve risk, including possible loss of principal. Investments in specialized industry sectors have additional risks, which are outlines in the prospectus.
All performance referenced is historical and is no guarantee of future results.
Indexes are unmanaged index and cannot be invested into directly. Unmanaged index returns do not reflect fees, expenses, or sales charges. Index performance is not indicative of the performance of any investment. Past performance is no guarantee of future results.
The economic forecasts set forth in the presentation may not develop as predicted. The opinions voiced in this material are for general information only and are not intended to provide or be construed as providing specific investment advice or recommendations for any individual security.
There is no assurance that the techniques and strategies discussed are suitable for all investors or will yield positive outcomes. The purchase of certain securities may be required to affect some of the strategies.
This information is not intended to be a substitute for specific individualized tax, legal or investment planning advice. We suggest that you discuss your specific tax issues with a qualified tax advisor.
Mortgage-backed securities are subject to credit, default, prepayment risk that acts much like call risk when you get your principal back sooner than the stated maturity, extension risk, the opposite of prepayment risk, market and interest rate risk.
Currency risk is a form of risk that arises from the change in price of one currency against another. Whenever investors or companies have assets or business operations across national borders, they face currency risk if their positions are not hedged.
Commodity-linked investments may be more volatile and less liquid than the underlying instruments or measures, and their value may be affected by the performance of the overall commodities baskets as well as weather, geopolitical events, and regulatory developments.
DEFINITIONS
Credit quality is one of the principal criteria for judging the investment quality of a bond. As the term implies, credit quality informs investors of a bond or bond portfolio’s credit worthiness, or risk of default. Different agencies employ different rating scales for credit quality. Standard & Poor’s (S&P) and Fitch both use scales from AAA (highest) through AA, A, BBB, BB, B, CCC, CC, C to D (lowest). Moody’s uses a scale from Aaa (highest) through Aa, A, Baa, Ba, B, Caa, Ca to C (lowest).
Default rate is the rate in which debt-holders default on the amount of money that they owe. It is often used by credit card companies when setting interest rates, but also refers to the rate at which corporations default on their loans. Default rates tend to rise during economic downturns, since investors and businesses see a decline in income and sales while still required to pay off the same amount of debt.
London interbank offered rate (Libor): An interest rate at which banks can borrow funds, in marketable size, from other banks in the London interbank market. The Libor is fixed on a daily basis by the British Bankers’ Association. The Libor is derived from a filtered average of the world’s most creditworthy banks’ interbank deposit rates for larger loans with maturities between overnight and one full year.
Municipal Market Advisors is an independent strategy, research and advisory firm.
Spread is the difference between the bid and the ask price of a security or asset.
Leverage is the degree to which a company uses fixed-income securities such as debt and preferred equity. The more debt financing a company uses, the higher its financial leverage.
INDEX DESCRIPTIONS
Barclays Corporate Bond Index is an unmanaged index of investment grade rated bonds issued by corporations and quasi-government agencies. Corporate bonds issued by foreign entities but denominated in U.S. dollars are also included in the index.
The Barclays Emerging Markets USD Aggregate Index is a flagship hard currency Emerging Markets debt benchmark that includes fixed and floating-rate US dollardenominated debt issued from sovereign, quasi-sovereign, and corporate EM issuers. Country eligibility and classification as Emerging Markets is rules-based and reviewed annually using World Bank income group and International Monetary Fund (IMF) country classifications. This index was previously called Barclays US EM Index, and history is available back to 1993.
Barclays High Yield Bond Index is an unmanaged index of corporate bonds rated below investment grade by Moody’s, S&P or Fitch Investor Service. The index also includes bonds not rated by the ratings agencies.
Barclays U.S. Aggregate Bond Index is comprised of the Barclays Government/Corporate Bond Index, Mortgage-Backed Securities Index, and Asset-Backed Securities Index, including securities that are of investment grade quality or better, have at least one year to maturity, and have an outstanding par value of at least $100 million.
The Barclays U.S. Corporate High-Yield Index measures the market of USD-denominated, noninvestment-grade, fixed-rate, taxable corporate bonds. Securities are classified as high yield if the middle rating of Moody’s, Fitch, and S&P is Ba1/BB+/BB+ or below, excluding emerging markets debt.
The Barclays U.S. High Yield Municipal Bond Index is an unmanaged index made up of bonds that are noninvestment grade, unrated, or rated below Ba1 by Moody’s Investors Service with a remaining maturity of at least one year.
The Barclays U.S. Municipal Index covers the USD-denominated, long-term, tax-exempt bond market. The index has four main sectors: state and local general obligation bonds, revenue bonds, insured bonds, and prerefunded bonds.
The Barclays U.S. Treasury Index is an unmanaged index of public debt obligations of the U.S. Treasury with a remaining maturity of one year or more. The index does not include T-bills (due to the maturity constraint), zero coupon bonds (Strips), or Treasury Inflation-Protected Securities (TIPS).
The BofA Merrill Lynch Preferred Stock Hybrid Securities Index is an unmanaged index consisting of a set of investment-grade, exchange-traded preferred stocks with outstanding market values of at least $50 million that are covered by Merrill Lynch Fixed Income Research.
Citigroup 3-Month T-Bill Index represents monthly return equivalents of yield averages of the last 3-month Treasury bill issues.
The Credit Suisse Leveraged Loan Index is designed to mirror the investable universe of the U.S. dollar-denominated leveraged loan market. Loan facilities must be rated “5B” or lower. That is, the highest Moody’s/S&P ratings are Baa1/BB+ or Ba1/BBB+. If unrated, the initial spread level must be Libor plus 125 basis points or higher. Only fully funded, term loan facilities are included. The tenor must be at least one year. Issuers must be domiciled in developed countries; issuers from developing countries are excluded.
The JPMorgan Emerging Markets Bond Index Global (“EMBI Global”) tracks total returns for traded external debt instruments in the emerging markets, and is an expanded version of the JPMorgan EMBI+. As with the EMBI+, the EMBI Global includes U.S. dollar-denominated Brady bonds, loans, and Eurobonds with an outstanding face value of at least $500 million. It covers more of the eligible instruments than the EMBI+ by relaxing somewhat the strict EMBI+ limits on secondary market trading liquidity.
The Russell 3000 Index measures the performance of the largest 3,000 U.S. companies representing approximately 98% of the investable U.S. equity market.
INVESTMENT OBJECTIVES
Aggressive Growth will essentially be fully invested in equity assets at all times (with the exception of a 5% cash position). Investors in this portfolio should have a long time horizon of 10 years or more, an understanding of the volatile history of equity investments, and a propensity to add money to the account on a systematic basis. This portfolio is very aggressive by nature and should not be considered by anyone unwilling to take on significant risk.
Growth will be targeted to an allocation of 80% in equity assets and 20% in fixed income assets (including a 5% cash position). Investors in this portfolio should have a long time horizon, an understanding of the volatile history of equity investments, and a propensity to add money to the account on a systematic basis. This portfolio is aggressive by nature and should not be considered by anyone unwilling to take on significant risk.
Growth with Income Investors in this portfolio should have a long time horizon, and an understanding of the volatile history of equity investments. The primary investment objective of this portfolio is growth of principal. Fixed income assets are included to generate income and reduce overall volatility.
Income with Moderate Growth will be targeted to a normal allocation of 40% in equity assets and 60% in fixed income assets (including a 7% cash position). Investors in this portfolio should have a time horizon of more than five years, and be comfortable with the volatile history of equity investments. The primary investment objective of this portfolio is income, with growth of principal an important consideration. Fixed income assets form the core of the portfolio, generating income and lowering the portfolio’s overall volatility. Equity assets provide the opportunity for long-term growth of principal.
Income with Capital Preservation will be targeted to a normal allocation of 21% in equity assets and 79% in fixed income assets (including a 10% cash position). Investors in this portfolio should have a time horizon of more than five years, and be comfortable with the volatility that will occur within the modest equity portion of their investment portfolio. The primary investment objective of this portfolio is income, with growth of principal as a secondary concern. Fixed income assets form the core of the portfolio, generating a steady income stream. A small investment in equity assets provides the opportunity for modest long-term growth of principal.
This research material has been prepared by LPL Financial LLC.
To the extent you are receiving investment advice from a separately registered independent investment advisor, please note that LPL Financial LLC is not an affiliate of and makes no representation with respect to such entity.
Not FDIC or NCUA/NCUSIF Insured | No Bank or Credit Union Guarantee | May Lose Value | Not Guaranteed by Any Government Agency | Not a Bank/Credit Union Deposit
Tracking #1-492450 (Exp. 08/16)