
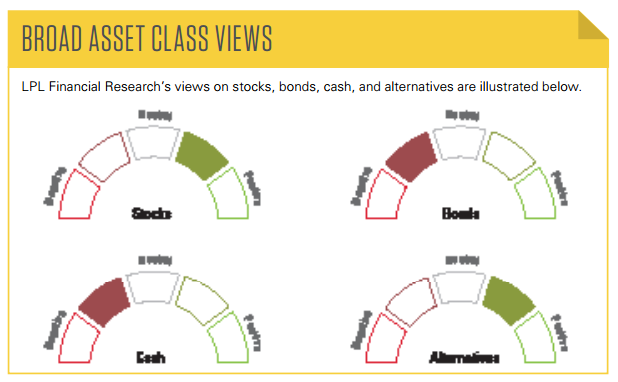
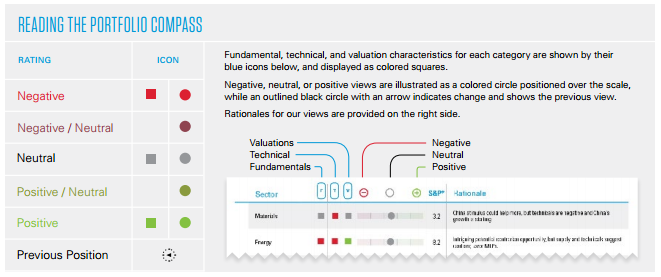
The Portfolio Compass provides a snapshot of LPL Financial Research’s views on equity, equity sectors, fixed income, and alternative asset classes. This biweekly publication illustrates our current views and will change as needed over a 3- to 12-month time horizon.
The top down is an important part of our asset allocation process. As a result, we have a new macro section including our views of the global economy and key drivers of those views, and a section on what we are watching that might change those views.
Click here to download a PDF of this report.
NAVIGATING THE MARKETS
COMPASS CHANGES
- Upgraded financials to neutral from negative/neutral.
- Downgraded healthcare to neutral from neutral/positive.
- Upgraded Treasuries to negative/neutral from negative.
INVESTMENT TAKEAWAYS
- We forecast high-single-digit S&P 500 returns in 2015* driven by mid-single-digit earnings growth, as discussed in our Midyear Outlook 2015 publication.
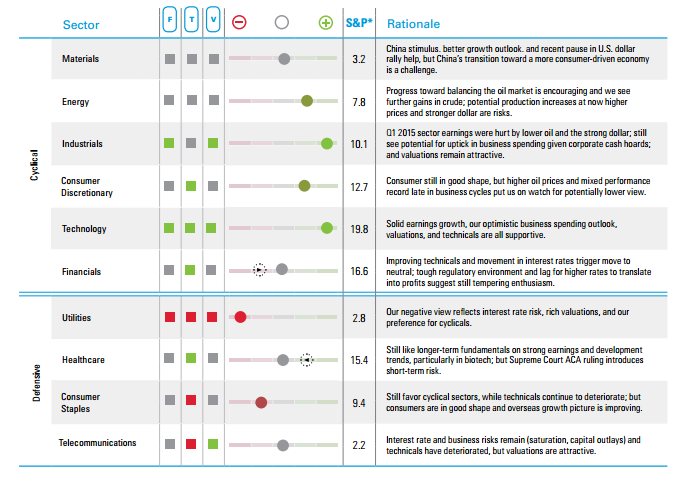
- We have upgraded financials due to higher interest rates and improved technicals.
- The Supreme Court Affordable Care Act (ACA) ruling introduces short-term risk for healthcare; we maintain a positive intermediate- to longer-term view.
- Optimism over a Greek resolution, a benign Federal Reserve (Fed) meeting, and modest improvement in economic data continue to pressure bond prices. Despite higher interest rates, valuations remain expensive by historical comparison.
- For fixed income allocations, we emphasize a blend of high-quality intermediate bonds and less interest rate–sensitive sectors such as high-yield bonds and bank loans.
- From a technical perspective, the S&P 500 price remains above a positively sloping 200-day simple moving average, which supports a long-term bullish trend.
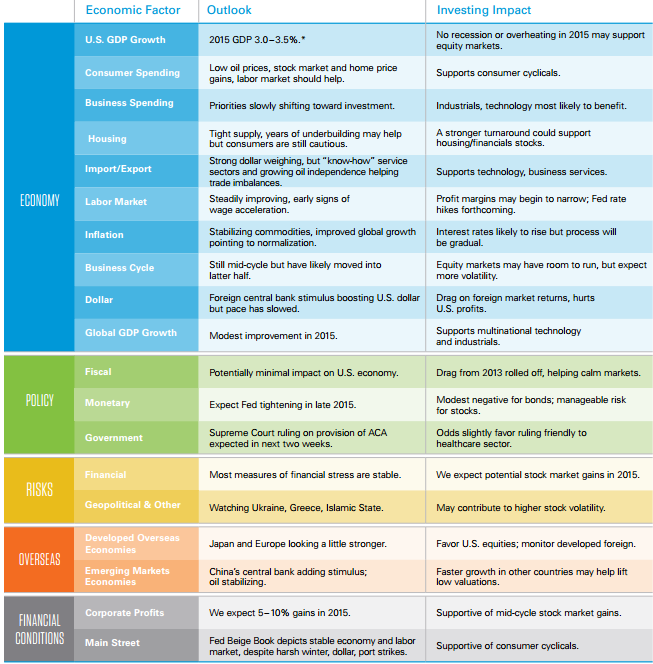
MACROECONOMIC VIEWS
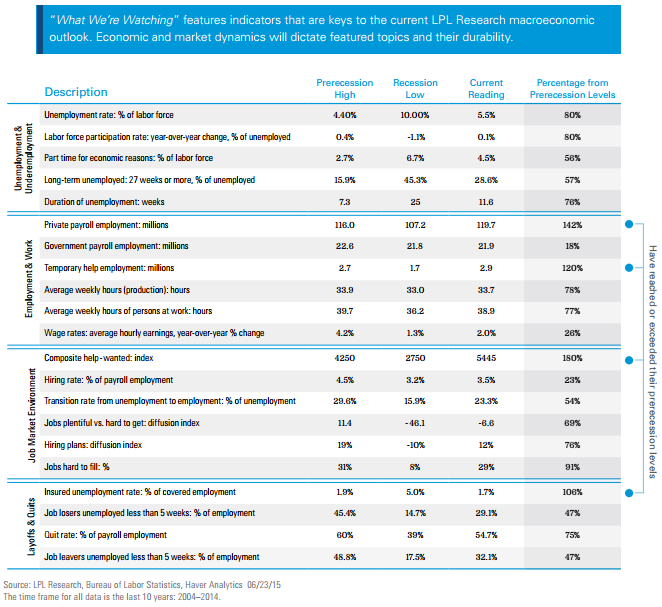
WHAT WE’RE WATCHING
As we highlighted in our Outlook 2015: In Transit, the Fed is watching a number of labor market indicators to help determine an appropriate timetable for interest rate hikes. We expect the Fed to begin its rate hike campaign in late 2015, but the pace of hikes will likely be gradual and reflect the progress in the various labor indicators listed here. Fed Chair Yellen’s labor market indicators are making progress, but have not yet reached full health, providing support for continued monetary policy support from the Fed.
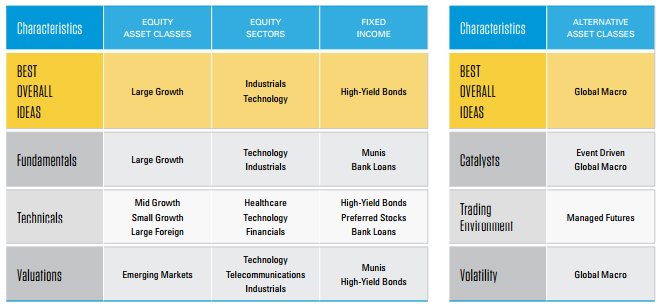
ASSET CLASS & SECTOR TOP PICKS
Below we provide our top overall ideas across the various asset classes and sectors covered in this publication, as well as our best ideas within the three disciplines of our investment process: fundamentals, technicals, and valuations. More details on these and other investment ideas can be found in subsequent pages.
EQUITY ASSET CLASSES
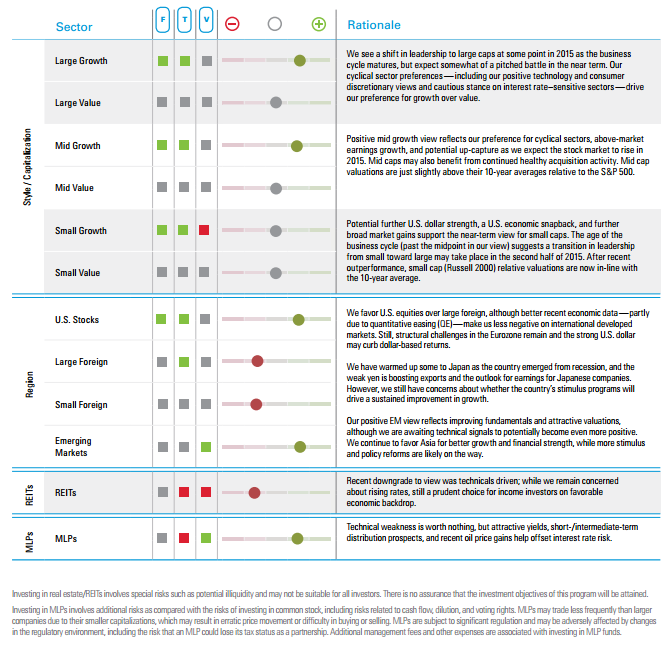
We forecast high-single-digit S&P 500 returns for 2015, driven by mid-single-digit earnings growth and little, if any, PE ratio expansion, as discussed in our Midyear Outlook 2015 publication. We favor U.S. equities and emerging markets over developed foreign, but our developed foreign view has become more positive on improved economic data and earnings growth. We expect a market leadership transition to large caps to occur at some point in the second half of 2015. Our sector preferences continue to support growth over value. We find MLPs attractive, particularly for income-oriented investors, for their yields and potential to benefit from higher oil prices.
EQUITY SECTORS
We continue to favor cyclical growth sectors, which tend to do well during the middle to late stages of the business cycle, with a focus on industrials and technology. Our modestly positive energy sector view reflects recent progress toward balancing supply and demand in the U.S., which we expect to support higher oil prices. The Supreme Court’s Affordable Care Act (ACA) ruling introduces short-term risk for healthcare, where we maintain a positive intermediate- to longer-term view.
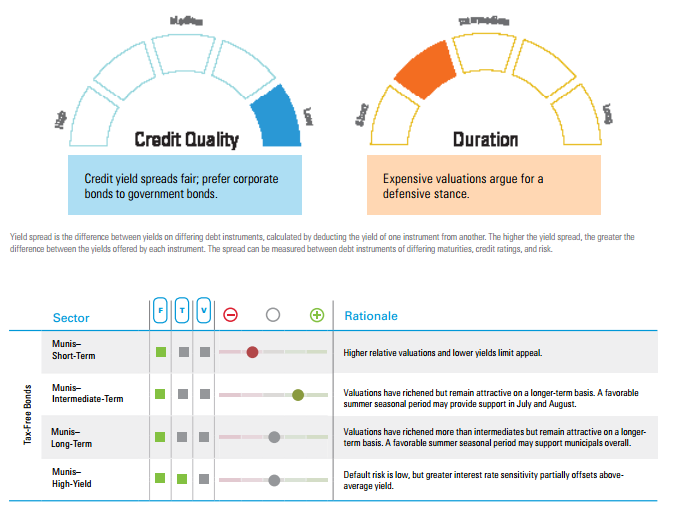
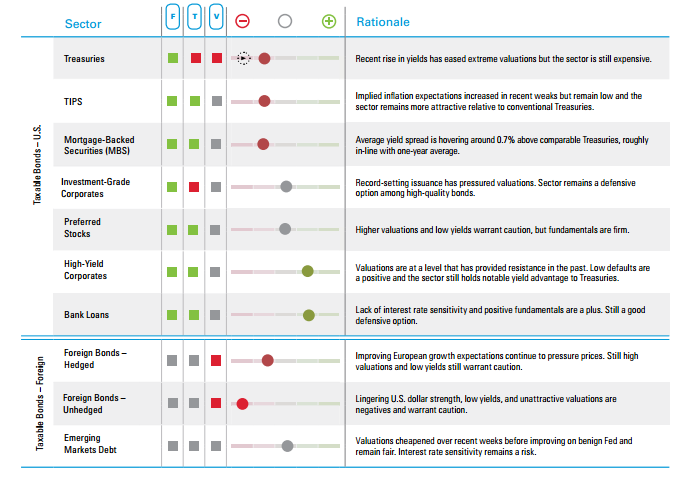
FIXED INCOME
We prefer corporate bonds over higher-quality government bonds due to their relatively higher yields and the financial health of corporate America. Although yields increased in May, yields remain low and and valuations expensive, which argues for a defensive stance on fixed income by maintaining a lower than average portfolio interest rate sensitivity.
FIXED INCOME (CONTINUED)
Optimism over a Greek resolution, a benign Fed meeting, and modest improvement in second quarter economic data continue to pressure bond prices. Despite the rise in yields, valuations remain expensive by historical comparison and augur for low future returns for high-quality bonds. For fixed income allocations, we emphasize a blend of high-quality intermediate bonds coupled with less interest rate–sensitive sectors such as high-yield bonds and bank loans.
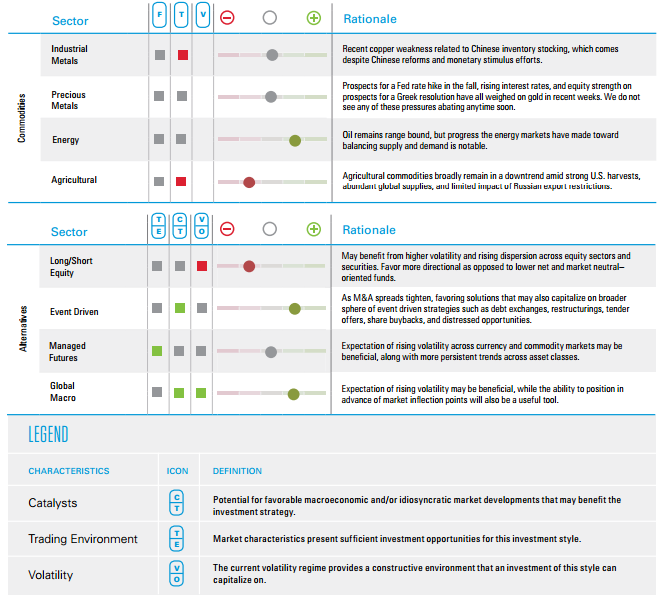
COMMODITIES & ALTERNATIVE ASSET CLASSES
Technical weakness and U.S. dollar strength keep us cautious on commodities broadly, although we see more potential upside to oil prices as supply and demand get better aligned in the months ahead. The risk now is that higher prices may attract more production. Divergent central bank policy may lead to higher market volatility and more asset dispersion, creating a more fertile environment for macro strategies. Since narrowly led equity markets have proven difficult for equity-oriented alternative strategies, we favor higher beta options there until individual stock selection is better rewarded.
DEFINITIONS:
EQUITY AND ALTERNATIVES ASSET CLASSES
Large Growth: Stocks in the top 70% of the capitalization of the U.S. equity market are defined as large cap. Growth is defined based on fast growth (high growth rates for earnings, sales, book value, and cash flow) and high valuations (high price ratios and low dividend yields).
Large Value: Stocks in the top 70% of the capitalization of the U.S. equity market are defined as large cap. Value is defined based on low valuations (low price ratios and high dividend yields) and slow growth (low growth rates for earnings, sales, book value, and cash flow).
Mid Growth: The U.S. mid cap range for market capitalization typically falls between $1 billion and $8 billion and represents 20% of the total capitalization of the U.S. equity market. Growth is defined based on fast growth (high growth rates for earnings, sales, book value, and cash flow) and high valuations (high price ratios and low dividend yields).
Mid Value: The U.S. mid cap range for market capitalization typically falls between $1 billion and $8 billion and represents 20% of the total capitalization of the U.S. equity market. Value is defined based on low valuations (low price ratios and high dividend yields) and slow growth (low growth rates for earnings, sales, book value, and cash flow).
Small Growth: Stocks in the bottom 10% of the capitalization of the U.S. equity market are defined as small cap. Growth is defined based on fast growth (high growth rates for earnings, sales, book value, and cash flow) and high valuations (high price ratios and low dividend yields).
Small Value: Stocks in the bottom 10% of the capitalization of the U.S. equity market are defined as small cap. Value is defined based on low valuations (low price ratios and high dividend yields) and slow growth (low growth rates for earnings, sales, book value, and cash flow).
U.S. Stocks: Stock of companies domiciled in the U.S.
Large Foreign: Large cap foreign stocks have market capitalizations greater than $5 billion. The majority of the holdings in the large foreign category are in the MSCI EAFE Index.
Small Foreign: Small cap foreign stocks typically have market capitalizations of $250 million to $1 billion. The majority of the holdings in the small foreign category are in the MSCI Small Cap EAFE Index.
Emerging Markets: Stocks of a single developing country or a grouping of developing countries. For the most part, these countries are in Eastern Europe, Africa, the Middle East, Latin America, the Far East, and Asia.
REITs: REITs are companies that develop and manage real estate properties. There are several different types of REITs, including apartment, factory-outlet, health care, hotel, industrial, mortgage, office, and shopping center REITs. This would also include real estate operating companies.
Commodities – Industrial Metals: Stocks in companies that mine base metals such as copper, aluminum, and iron ore. Also included are the actual metals themselves. Industrial metals companies are typically based in North America, Australia, or South Africa.
Commodities – Precious Metals: Stocks of companies that do gold- silver-, platinum-, and base-metal mining. Precious metals companies are typically based in North America, Australia, or South Africa.
Commodities – Energy: Stocks of companies that focus on integrated energy, oil and gas services, oil and gas exploration and equipment. Public energy companies are typically based in North America, Europe, the United Kingdom, and Latin America.
Currency risk is a form of risk that arises from the change in price of one currency against another. Whenever investors or companies have assets or business operations across national borders, they face currency risk if their positions are not hedged.
Event Driven: A hedge fund strategy in which the stocks of two merging companies are simultaneously bought and sold to create a riskless profit. A merger arbitrageur looks at the risk that the merger deal will not close on time, or at all. Because of this slight uncertainty, the target company’s stock will typically sell at a discount to the price that the combined company will have when the merger is closed. This discrepancy is the arbitrageur’s profit.
Long/Short: An investment strategy generally associated with hedge funds. It involves buying long equities that are expected to increase in value and selling short equities that are expected to decrease in value.
Managed Futures: Managed futures use systematic quantitative programs to find and invest in positive and negative trends in the futures markets for financials and commodities. Historically, the benefit of managed futures have been solid long-term returns with very low correlation to equities and fixed income securities.
The Simple Moving Average is an arithmetic, moving average that is calculated by adding the closing price of the security for a number of time periods and then dividing this total by the number of time periods. Short-term averages respond quickly to changes in the price of the underlying, while long-term averages are slow to react.
Up-capture is a statistical measure of a investment manager’s overall performance in up-markets. The up-market capture ratio is used to evaluate how well an investment manager performed relative to an index during periods when that index has risen.
The PE ratio (price-to-earnings ratio) is a measure of the price paid for a share relative to the annual net income or profit earned by the firm per share. It is a financial ratio used for valuation: a higher PE ratio means that investors are paying more for each unit of net income, so the stock is more expensive compared to one with lower PE ratio.
Beta measures a portfolio’s volatility relative to its benchmark. A beta greater than one suggests the portfolio has historically been more volatile than its benchmark. A beta less than one suggests the portfolio has historically been less volatile than its benchmark.
The Beige Book is a commonly used name for the Federal Reserve’s (Fed) report called the Summary of Commentary on Current Economic Conditions by Federal Reserve District. It is published just before the Federal Open Market Committee (FOMC) meeting on interest ratesand is used to inform the members on changes in the economy since the last meeting.
FIXED INCOME
Credit Quality: One of the principal criteria for judging the investment quality of a bond or bond mutual fund. As the term implies, credit quality informs investors of a bond or bond portfolio’s credit worthiness, or risk of default.
Duration: A measure of the sensitivity of the price (the value of principal) of a fixed-income investment to a change in interest rates. Duration is expressed as a number of years. Rising interest rates mean falling bond prices, while declining interest rates mean rising bond prices. The bigger the duration number, the greater the interest rate risk or reward for bond prices.
Munis – Short-Term: Bonds issued by various state and local governments to fund public projects. The income from these bonds is generally free from federal taxes. These bonds generally have maturities of less than three years.
Munis – Intermediate: Bonds issued by various state and local governments to fund public projects. The income from these bonds is generally free from federal taxes. These bonds generally have maturities of between 3 and 10 years.
Munis – Long-Term: Bonds issued by various state and local governments to fund public projects. The income from these bonds is generally free from federal taxes. These bonds generally have maturities of more than 10 years.
Munis – High-Yield: Bonds issued by various state and local governments to fund public projects. The income from these bonds is generally free from federal taxes. These bonds generally offer higher yields than other types of bonds, but they are also more vulnerable to economic and credit risk. These bonds are rated BB+ and below.
Treasuries: A marketable, fixed-interest U.S. government debt security. Treasury bonds make interest payments semiannually and the income that holders receive is only taxed at the federal level.
TIPS (Treasury Inflation-Protected Securities): A special type of Treasury note or bond that offers protection from inflation. Like other Treasuries, an inflation-indexed security pays interest every six months and pays the principal when the security matures. The difference is that the underlying principal is automatically adjusted for inflation as measured by the consumer price index (CPI).
Mortgage-Backed Securities: A type of asset-backed security that is secured by a mortgage or collection of mortgages. These securities must also be grouped in one of the top two ratings as determined by a accredited credit rating agency, and usually pay periodic payments that are similar to coupon payments. Furthermore, the mortgage must have originated from a regulated and authorized financial institution.
Investment-Grade Corporates: Securities issued by corporations with a credit rating of BBB or higher. Bond rating firms, such as Standard & Poor’s, use different designations consisting of upper- and lower-case letters A and B to identify a bond’s investment-grade credit quality rating. AAA and AA (high credit quality) and A and BBB (medium credit quality) are considered investment-grade.
Preferred Stocks: A class of ownership in a corporation that has a higher claim on the assets and earnings than common stock. Preferred stock generally has a dividend that must be paid out before dividends to common stockholders and the shares usually do not have voting rights.
High-Yield Corporates: Securities issued by corporations with a credit rating of BB+ and below. These bonds generally offer higher yields than investment-grade bonds, but they are also more vulnerable to economic and credit risk.
Bank Loans: In exchange for their credit risk, these floating-rate bank loans offer interest payments that typically float above a common short-term benchmark such as the London Inter-Bank Offered Rate, or LIBOR.
Foreign Bonds – Hedged: Non-U.S. fixed income securities generally from investment-grade issuers in developed countries, with hedged currency exposure.
Foreign Bonds – Unhedged: Non-U.S. fixed income securities normally denominated in major foreign currencies.
Emerging Markets Debt: The debt of sovereigns, agencies, local issues, and corporations of emerging markets countries and subject to currency risk.
IMPORTANT DISCLOSURES
The opinions voiced in this material are for general information only and are not intended to provide or be construed as providing specific investment advice or recommendations for any individual. To determine which investments may be appropriate for you, consult your financial advisor prior to investing. All performance referenced is historical and is no guarantee of future results. All indexes are unmanaged and cannot be invested into directly.
Past performance is no guarantee of future results.
Stock investing involves risk including loss of principal.
Preferred stock investing involves risk, which may include loss of principal.
The Standard & Poor’s 500 Index is a capitalization-weighted index of 500 stocks designed to measure performance of the broad domestic economy through changes in the aggregate market value of 500 stocks representing all major industries.
The Russell 2000 Index measures the performance of the small cap segment of the U.S. equity universe. The Russell 2000 Index is a subset of the Russell 3000 Index representing approximately 10% of the total market capitalization of that index.
This research material has been prepared by LPL Financial.
To the extent you are receiving investment advice from a separately registered independent investment advisor, please note that LPL Financial is not an affiliate of and makes no representation with respect to such entity.
Not FDIC or NCUA/NCUSIF Insured | No Bank or Credit Union Guarantee | May Lose Value | Not Guaranteed by Any Government Agency | Not a Bank/Credit Union Deposit
Tracking #1-395019