
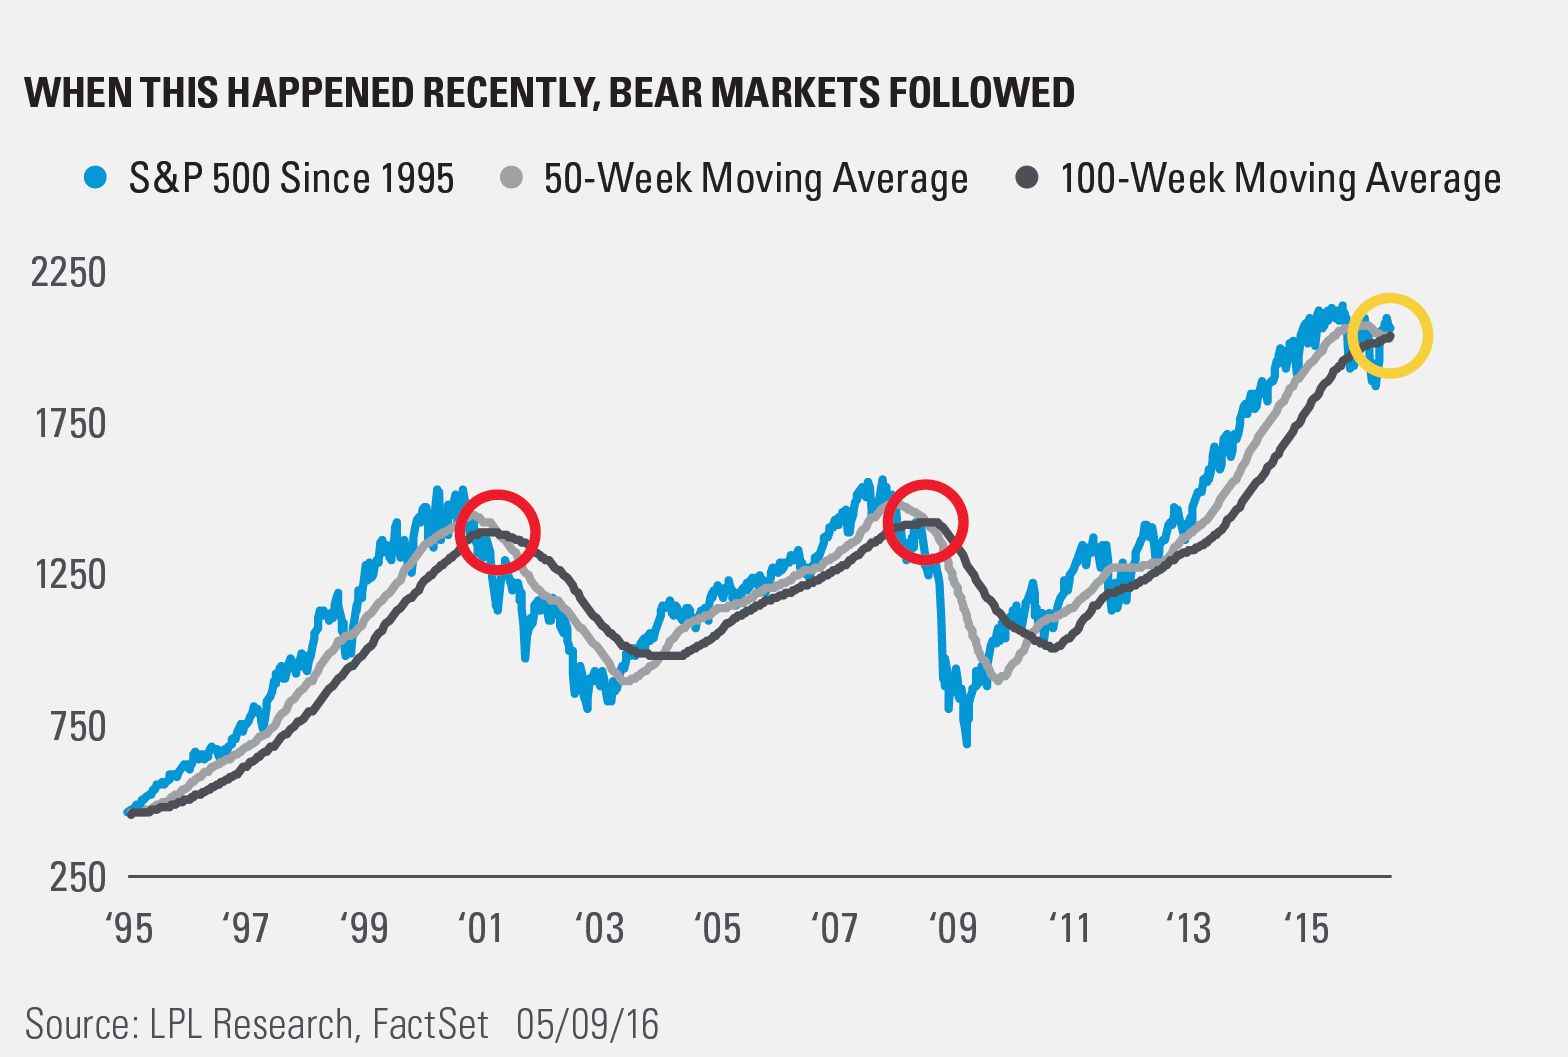
An ominous technical formation took place last week, and it had social media in an uproar as a result over the past few days. The S&P 500’s slower moving 100-week moving average crossed above its faster moving 50-week moving average last week. This is important, because going back 20 years, this has only happened two other times and each led to a vicious bear market.
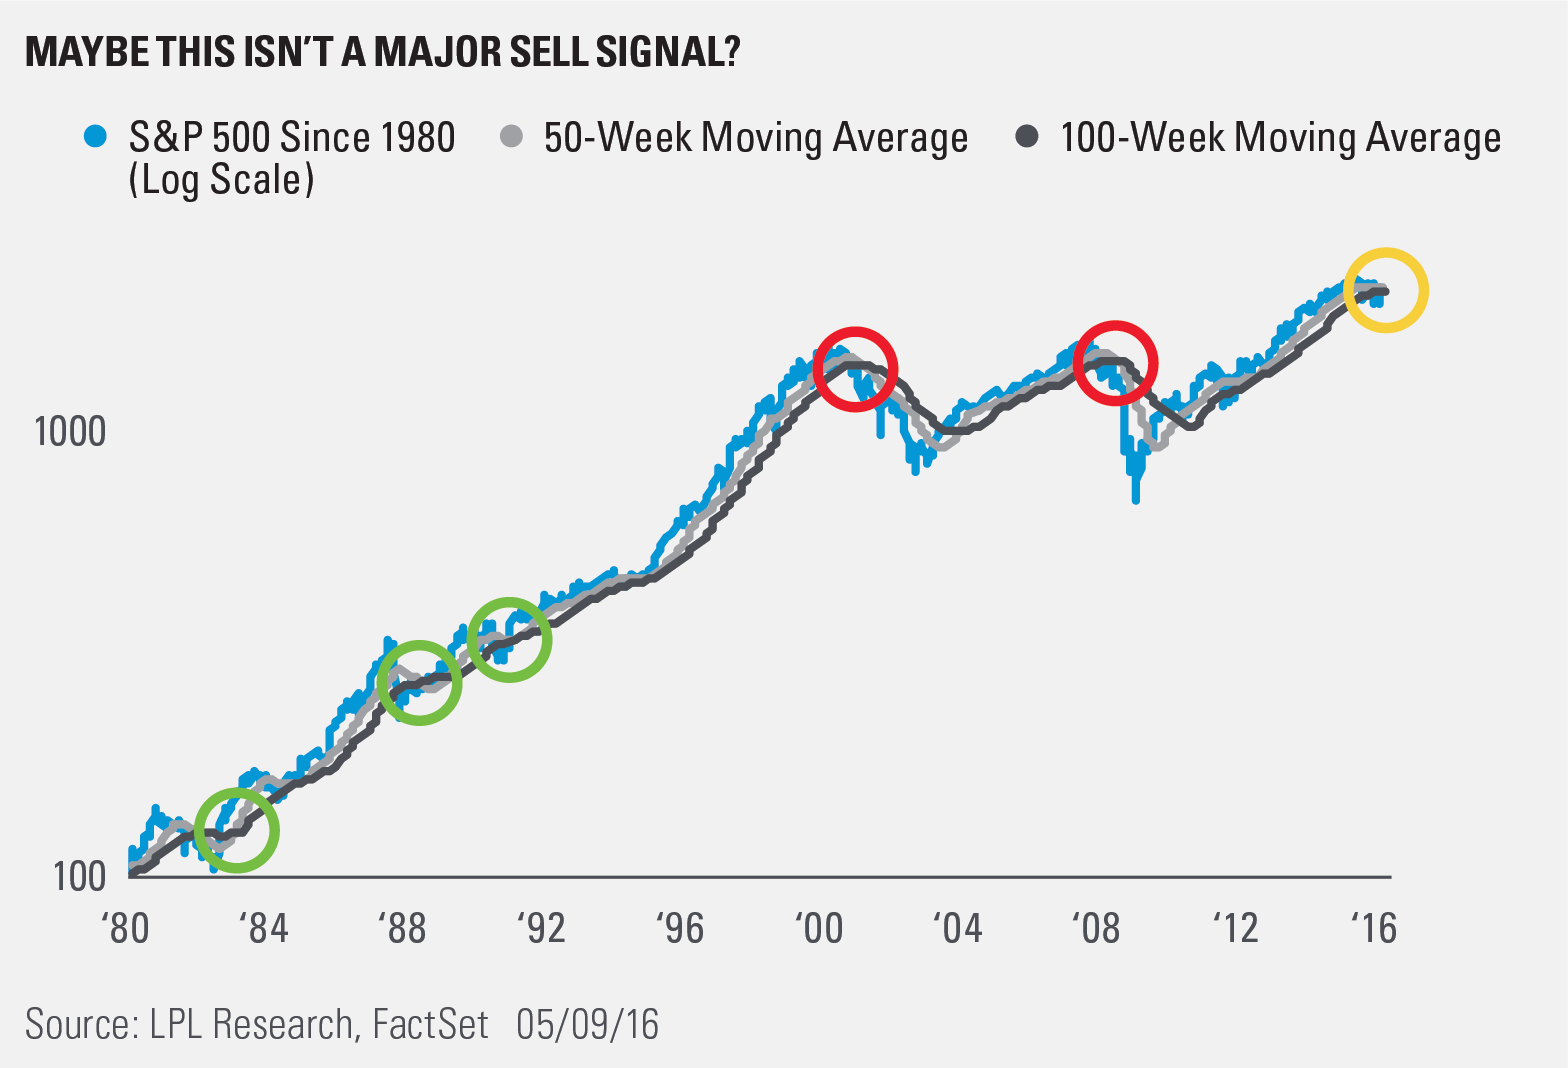
Here’s where it pays to dig a little deeper when you see a chart like the one above. Going back in history, it turns out this isn’t quite the major sell signal that it might seem. Going back to 1980, this moving average cross also occurred in 1982, 1984, and 1988—and all took place in the midst of a nice bull market.
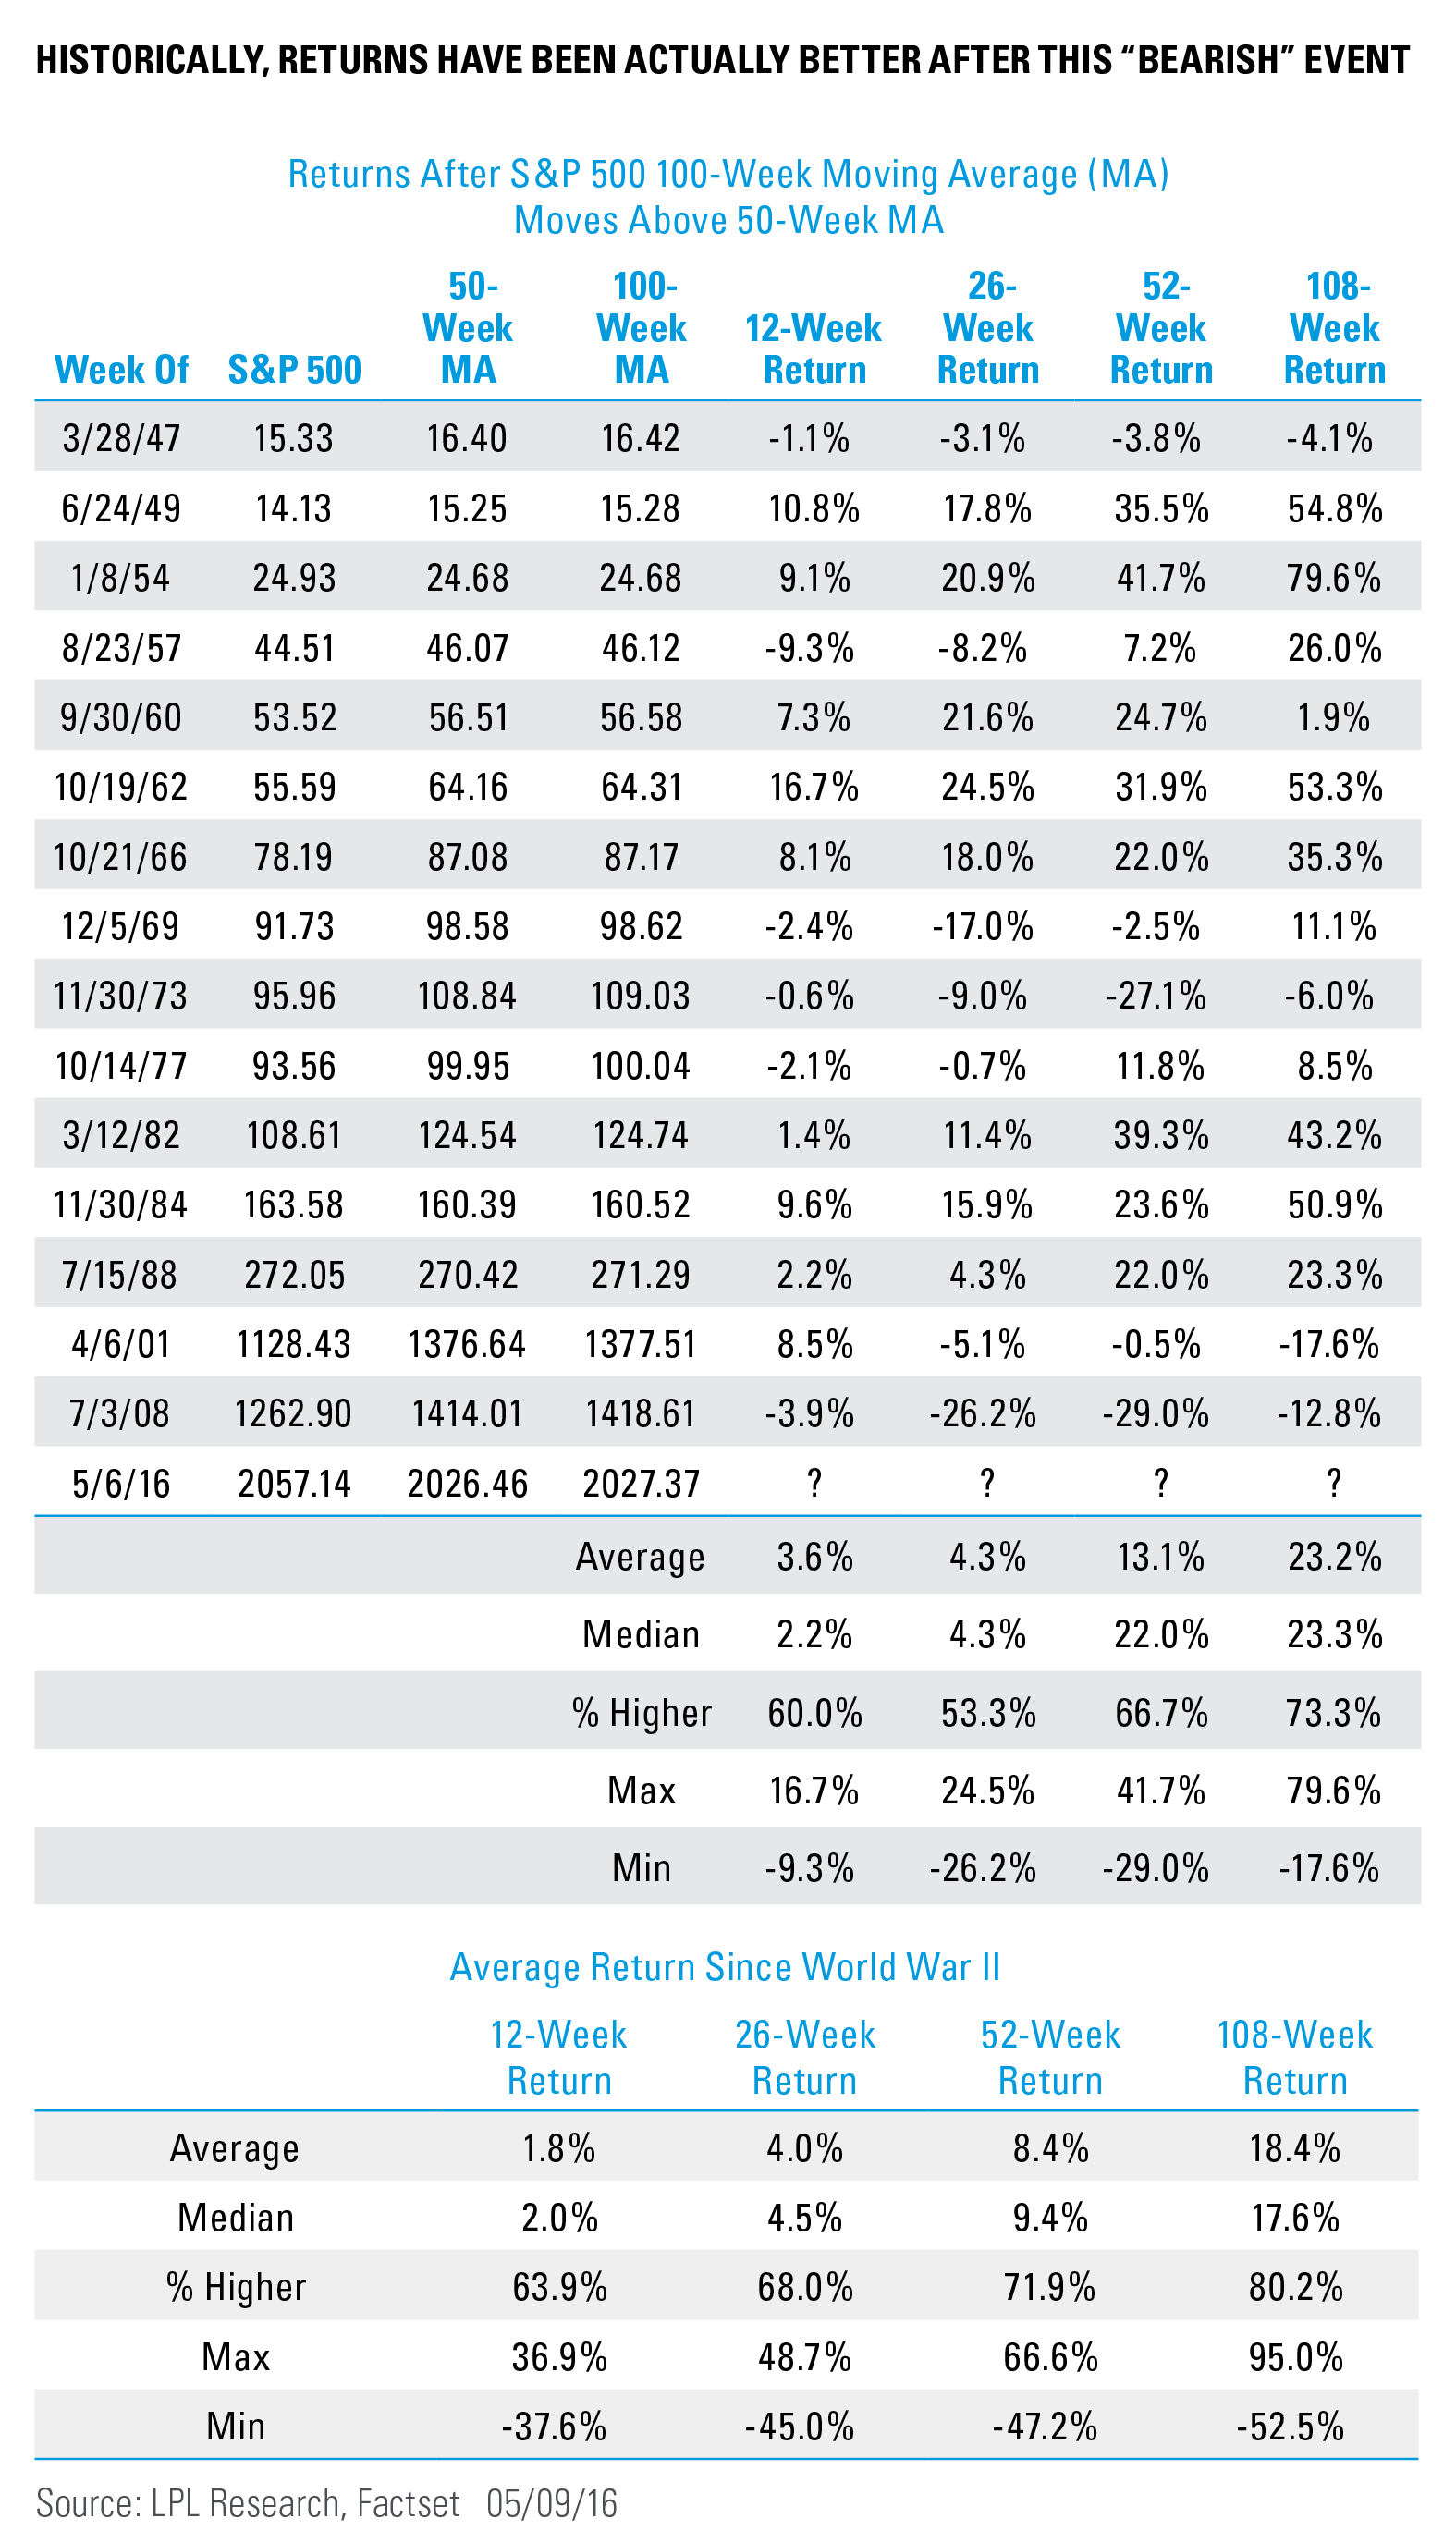
Last, going back to World War II (WWII), the table below outlines all the times this moving average cross took place. The previous 15 times it happened, the returns going out 12, 26, 52, and 108 weeks later were actually stronger than the average returns for the S&P 500. The average return a year after this event is an impressive 13.1%, and the median return goes all the way up to 22.0%. Both are well above the average return since WWII. In other words, this “bearish chart” that was everywhere yesterday isn’t nearly as bearish as most would have probably assumed, without digging into the data.
IMPORTANT DISCLOSURES
Past performance is no guarantee of future results. All indexes are unmanaged and cannot be invested into directly. Unmanaged index returns do not reflect fees, expenses, or sales charges. Index performance is not indicative of the performance of any investment.
The economic forecasts set forth in the presentation may not develop as predicted.
The opinions voiced in this material are for general information only and are not intended to provide or be construed as providing specific investment advice or recommendations for any individual security.
Stock investing involves risk including loss of principal.
The S&P 500 Index is a capitalization-weighted index of 500 stocks designed to measure performance of the broad domestic economy through changes in the aggregate market value of 500 stocks representing all major industries.
This research material has been prepared by LPL Financial LLC.
To the extent you are receiving investment advice from a separately registered independent investment advisor, please note that LPL Financial LLC is not an affiliate of and makes no representation with respect to such entity.
Not FDIC/NCUA Insured | Not Bank/Credit Union Guaranteed | May Lose Value | Not Guaranteed by any Government Agency | Not a Bank/Credit Union Deposit
Securities and Advisory services offered through LPL Financial LLC, a Registered Investment Advisor
Member FINRA/SIPC
Tracking # 1-496235 (Exp. 05/17)