
The S&P 500 has gone a full year without a new high. We touched on this subject on this blog on Friday, and yesterday we did an in-depth look at this development in our Weekly Market Commentary. We want to take one final look at this, as some of the charts we created didn’t make the cut for the Weekly Market Commentary, but they are still worth sharing.
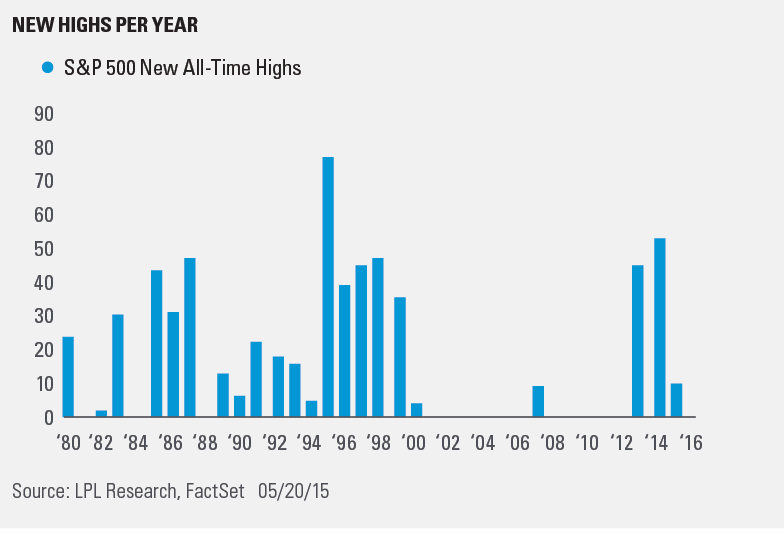
The S&P 500 hasn’t made a new high all year, after making 10 last year, 53 in 2014, and 45 in 2013. The record is 77 in 1995. Remember, the S&P 500 made a new high on September 16, 1929, and then didn’t close above that level again until September 22, 1954—25 years later. Maybe a year without a new high isn’t so bad when you put it in perspective?
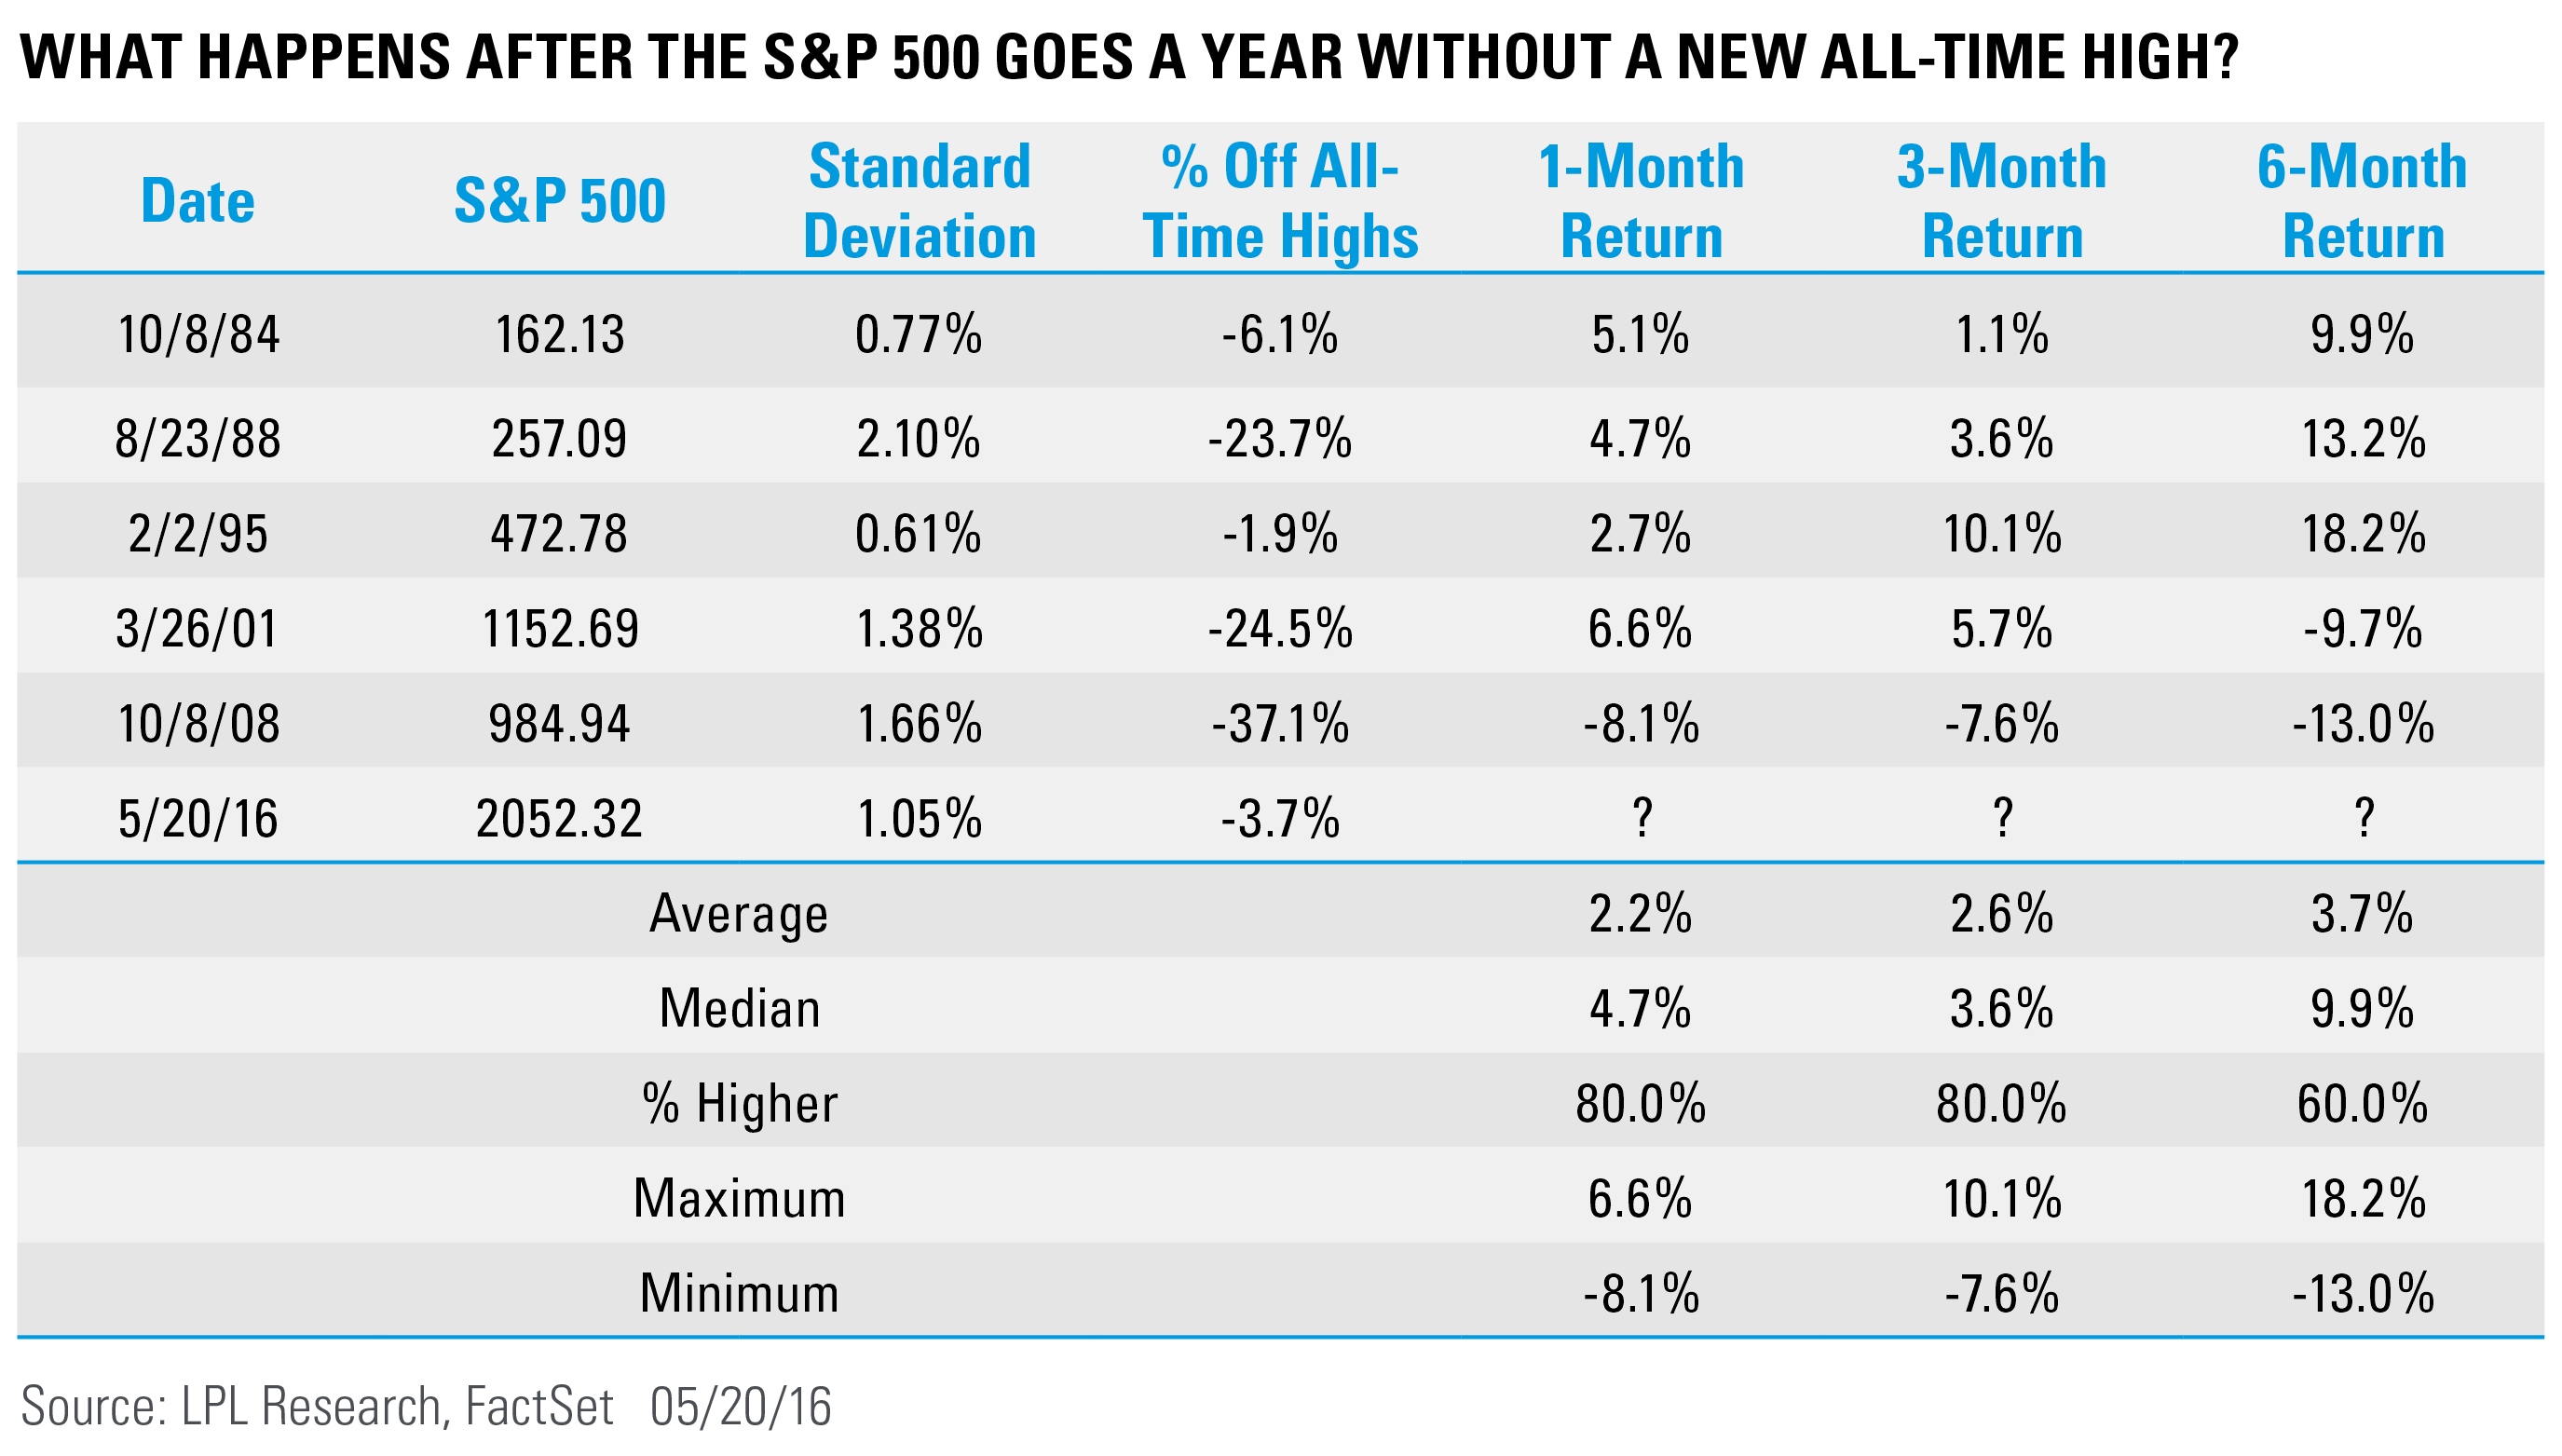
Let’s take a closer look at the six most recent times the S&P 500 went a full year without a new high. The two times before the current streak (2001 and 2008) were in the midst of significant bear markets. They also were 24% and 37% away from previous all-time highs, versus the 3.7% currently. Not to be outdone, those previous two times had standard deviations much higher than the current year. In other words, the current one-year period without a new high looks nothing like the previous two, which led to continued bear markets.
Breaking it down, the current one-year period without a new high looks more like 1983–84 and 1994–95. After a year without an all-time high, both still weren’t off that high by much, and both also had low volatility during the year without a new high, as measured by the standard deviation.
Did the bull market end a year ago? Maybe, but we won’t know until well after the fact. We continue to think that new highs will come later this year and equities will gain mid-single-digits when 2016 is over.* Given the current year without new highs matches up better with other occurrences that saw continued gains after a year without highs, we remain in the camp the bull market is not over quite yet.
IMPORTANT DISCLOSURES
*Historically since WWII, the average annual gain on stocks has been 7-9%. Thus, our forecast is roughly in-line with average stock market growth. We forecast a mid-single digit gain, including dividends, for U.S. stocks in 2016 as measured by the S&P 500. This gain is derived from earnings per share (EPS) for S&P 500 companies assuming mid-to-high-single-digit earnings gains, and a largely stable price-to-earnings ratio. Earnings gains are supported by our expectation of improved global economic growth and stable profit margins in 2016.
Past performance is no guarantee of future results. All indexes are unmanaged and cannot be invested into directly. Unmanaged index returns do not reflect fees, expenses, or sales charges. Index performance is not indicative of the performance of any investment.
The economic forecasts set forth in the presentation may not develop as predicted.
The opinions voiced in this material are for general information only and are not intended to provide or be construed as providing specific investment advice or recommendations for any individual security.
Stock investing involves risk including loss of principal.
The S&P 500 Index is a capitalization-weighted index of 500 stocks designed to measure performance of the broad domestic economy through changes in the aggregate market value of 500 stocks representing all major industries.
This research material has been prepared by LPL Financial LLC.
To the extent you are receiving investment advice from a separately registered independent investment advisor, please note that LPL Financial LLC is not an affiliate of and makes no representation with respect to such entity.
Not FDIC/NCUA Insured | Not Bank/Credit Union Guaranteed | May Lose Value | Not Guaranteed by any Government Agency | Not a Bank/Credit Union Deposit
Securities and Advisory services offered through LPL Financial LLC, a Registered Investment Advisor
Member FINRA/SIPC
Tracking #1-500589 (Exp. 05/17)