
KEY TAKEAWAYS
- The collapse in oil prices has impacted the entire equity market, an unusual pattern that is expected to eventually reverse.
- The inevitable rise in oil prices may create opportunities for suitable, savvy investors, but energy-related equities could be a preferred choice over simply buying oil through the commodities markets.
- Obtaining exposure to a potential energy rebound in oil via stocks can be achieved in various ways, each with their own risk, return characteristics, and correlation to oil price. Conventional valuation metrics may not be appropriate for energy equities.
Click here to download a PDF of this report.
OIL, OIL, EVERYWHERE
But Not a Drop to Buy?
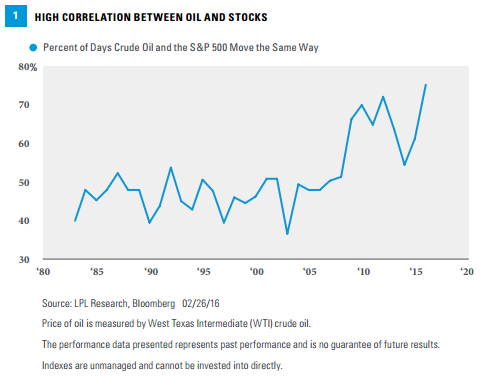
Despite the modest size of the energy sector (typically less than 10% of total market capitalization), crude oil and the broader stock market, as measured by the S&P 500, have had very high correlation during the past few months [Figure 1]. In fact, 51% of all days since 1983 have seen the S&P 500 and crude move in the same direction–essentially a coin flip. Yet, incredibly, 15 of the first 18 days of February have seen the two assets move in the same direction. This comes out to 83%, making February the fifth most correlated month ever, dating back to 1983. So far in 2016, the price of oil and the broad stock market have moved in the same direction 76% of all days, the highest correlation we’ve seen for any one year since 1983. While the past eight years have been the eight most highly correlated, the correlation thus far in 2016 has been extreme.
BETTING ON THE FUTURE(S)
Many investors are looking for opportunities in the wake of oil’s decline, believing that it is a matter of when and not if prices rebound. At current prices, there are ample opportunities in oil. The most obvious place to look is buying the commodity itself. On the surface, that is the simplest solution–price goes up, you make money. That may be true if you were buying a few barrels of oil and storing them for a while until the price goes up. But of course, that is not possible. Mutual funds (MF) and exchange-traded funds (ETF) seeking to benefit from oil price gains are actually comprised of futures contracts–the same oil futures that are quoted in the popular financial media.
A commodity futures contract is an exchange-traded derivative that constitutes a legally binding agreement to buy or sell as commodity at a later date. Futures contracts are standardized according to the quality, quantity, and delivery time and location for each commodity. The only variable is price.
The problem with futures contracts is that typically only the contracts that are close to expiration are liquid enough for these funds to hold. Most funds hold only the contract that is closest to expiration–referred to as the “prompt” contract. These contracts expire every month, with the existing contract having to be settled and the new “prompt” contract purchased. This process, called “rolling,” adds transaction costs. More importantly, that next contract may be trading at a price higher or lower than the current spot price (current price the commodity is bought or sold). When longer-dated contracts are more expensive than the current spot price, the market is in a condition known as “contango”; when longer-dated contracts are less expensive than the current spot price, the market is in “backwardation.” Any fund that holds futures contracts is forced to roll contracts every month. An investor’s return can be determined as much by the rolling process as the movement in the underlying commodity itself. This adds an unwanted complication to what theoretically is the simple process of buying a commodity in anticipation of increasing prices.
Commodity trading is highly speculative. Commodities and futures generally are volatile and are not suitable for investors. Commodity Futures-Linked Securities (CFLS) may be more volatile and less liquid than the underlying instruments or measures, and their value may be affected by the performance of the overall commodities baskets, as well as weather, disease, and government, economic, and regulatory developments. Certain CFLS investments may not be well diversified and therefore concentrated within particular assets, which may be subject to greater volatility.
INVESTING IN ENERGY COMPANIES
Trying to capture a rebound in oil prices might be better served by investing in energy companies. As a group, energy companies are fairly highly correlated to overall oil prices and are not subject to the technical issues that complicate futures investing. The wide variety of equity-based investment options allows investors to select different risk and return profiles, but the terminology around the various subsectors in the group can be confusing. For the purpose of this publication, the term “equity-based investment options” applies to liquid investments (ETFs, MFs, stock) that are publicly traded and widely accessible to the general public. As a quick guide, these are the primary types of energy-related companies:
- Integrated oil and gas. The large, global energy companies that own their own sources of oil and are involved in the refining and distribution of final products, mostly gasoline and diesel fuel. These companies are often the most stable, because they have diversified businesses.
- Exploration and production. The companies that own the oil or gas in the ground and are responsible for its extraction, often referred to as “upstream” companies. Their profitability is very sensitive to underlying commodity prices.
- Drilling. The companies that actually do the work of getting oil out of the ground. These companies are hired by the upstream companies; their revenue is not directly a function of energy prices.
- Equipment and services. Similar to drilling companies, these firms provide the pumps, valves, control systems, and other equipment necessary to get oil and gas out of the ground and into the transportation system.
- Refining. Companies that just refine and sell gasoline and diesel into the retail market, and are referred to as being “downstream.”
- Master limited partnerships (MLP). Publicly traded partnerships that are involved principally in the transportation of oil and gas. Because most MLPs are involved in movement of oil between the producer and the refiner, MLPs are sometimes referred to as being “midstream.” MLPs differ from other oil-related investments in that they are not taxed at the partnership level, provided they distribute more than 90% of their earnings. Therefore, MLPs attract investors who are yield oriented, and may not be focused on what happens in the energy market.
Investing in MLPs involves additional risks as compared to the risks of investing in common stock, including risks related to cash flow, dilution, and voting rights. MLPs may trade less frequently than larger companies due to their smaller capitalizations, which may results in erratic price moment or difficulty in buying or selling. MLPs are subject to significant regular and may be adversely affected by changes in the regulatory environment, including the risk that an MLP could lose its tax status as a partnership. Additional management fees and other expenses are associated with investing in an MLP fund.
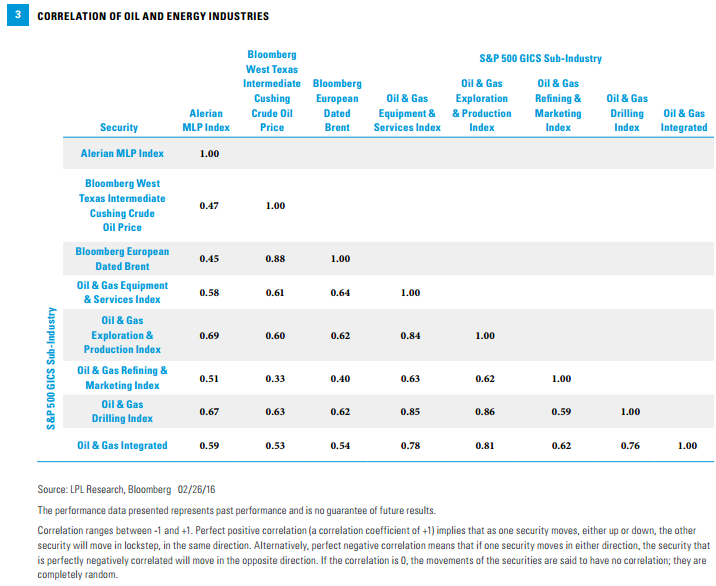
Each of these industry groups has its own degree of risk and return [Figure 2], and correlation to each other and the underlying price of oil [Figure 3]. For example, even though drilling companies do not directly participate in the movement of oil prices, this sector has had the highest correlation to oil prices. This is because rising prices spur exploration for new sources of energy, and thus major drilling projects. Drilling companies have also had the worst returns over the past 10 years, reflecting not merely the recent decline in prices, but the overall slowdown in global exploration since the global financial crisis. Drillers also have the highest volatility of any energy-related industry. Therefore, drillers represent the most speculative way to play an oil rebound, but may have a higher potential return should prices rebound to the point where exploration increases significantly.
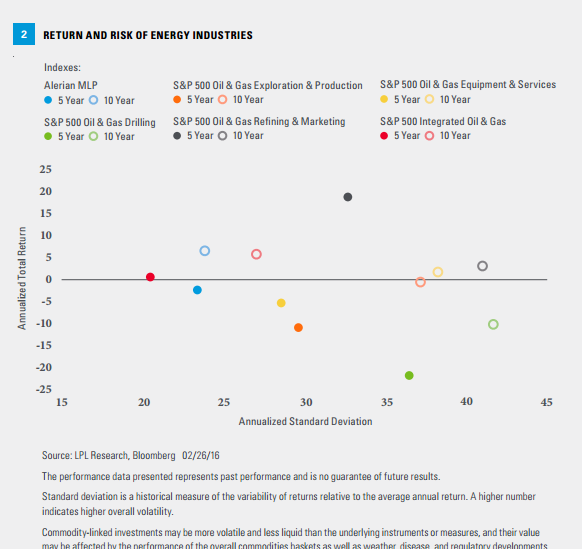
In contrast, the further an investor moves downstream (i.e., closer to the consumer buying gasoline or home heating oil) into sectors like pure refining companies, the lower the correlation to oil prices. For refiners, oil is an input cost, and lower input prices are a benefit to their business. Of course, that does not automatically translate to greater profits or better equity returns. If the economy weakens, demand–and therefore, the price of refined products–may decline by the same extent or even more than oil prices themselves.
In sum, investors must assess the degree of oil price sensitivity for each industry desired and whether they are comfortable with the associated risks.
THE VALUATION CHALLENGE
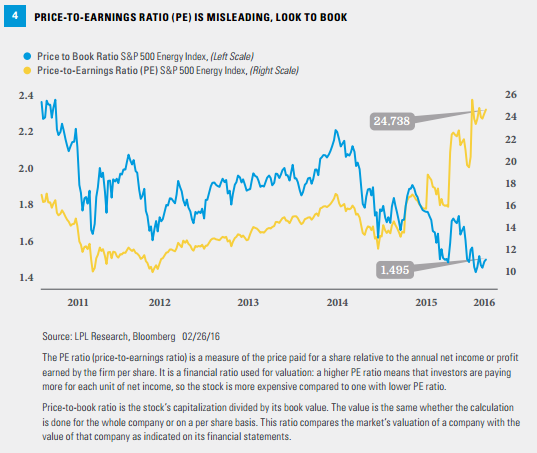
The final challenge facing investors evaluating energy industries is determining the right valuation metric. The big issue is that traditional price-to-earnings ratios (PE) are misleading [Figure 4]. Because the price of energy-related stocks tends to rise and fall with oil, PE ratios increase when oil prices fall. At current levels, energy stocks look expensive relative to their own history and compared with the broader market. Yet, should oil prices increase, earnings would be expected to increase and PE ratios fall. In other words, energy stocks may be cheapest when PE ratios are highest.
Better metrics for energy companies, especially exploration and production companies, are metrics that value the company based on the oil and gas assets it has claim to. This measure, referred to as net asset value (NAV), is determined by a formula known as PV10. The Securities and Exchange Commission (SEC) requires disclosure of PV10 for energy exploration and production companies. The calculation for PV10 is complicated, but involves reserves, depletion rates, expenses, and other factors. We show more traditional price-to-book (PB) value for energy companies in Figure 4 as an approximation of price-to-NAV. Though they are not identical measures, they are similar and historically move in the same direction.
Given current market conditions, energy stocks appear expensive if looking at PE and cheap if measured by PB. Which metric is accurate will depend on the ultimate direction of oil and gas prices.
CONCLUSION
Investors are naturally looking for investment opportunities, or a group that may be a market leader when and if the equity market recovers. Oil prices have collapsed and should eventually stabilize and turn higher, though the timing of this turnaround remains uncertain. However, if the correlation between oil prices and stocks continues to be elevated (as it has during the recent rebound in oil prices), it is not unreasonable that oil-related stocks would do well, and possibly even provide market leadership. Given the complications of investing in commodity futures-based ETFs, energy equities may be the preferred way to play any potential bounce in oil, provided this is a suitable investment based on an individual’s objectives. Investors face a number of choices in terms of industry selection and valuation metrics. Fortunately, there are a number of investment options to choose from to help make some of these decisions for them.
IMPORTANT DISCLOSURES
The opinions voiced in this material are for general information only and are not intended to provide specific advice or recommendations for any individual. To determine which investment(s) may be appropriate for you, consult your financial advisor prior to investing. All performance referenced is historical and is no guarantee of future results.
The economic forecasts set forth in the presentation may not develop as predicted and there can be no guarantee that strategies promoted will be successful.
Investing in stock includes numerous specific risks including: the fluctuation of dividend, loss of principal, and potential liquidity of the investment in a falling market.
All investing involves risk including loss of principal.
Because of its narrow focus, energy sector investing will be subject to greater volatility than investing more broadly across many sectors and companies.
Amounts in mutual funds are subject to fluctuations in value and market risk. Shares, when redeemed, may be worth more or less than their original cost.
An investment in exchange-traded products (ETP), structured as a mutual fund, note, or unit investment trust, should be considered as part of an overall program, not a complete investment program. An investment in ETPs involves risks such as: market, non-diversification, price volatility, liquidity, competitive industry pressure, international political and economic developments, possible trading halts, and index tracking error.
INDEX DESCRIPTIONS
The Standard & Poor’s 500 Index is a capitalization-weighted index of 500 stocks designed to measure performance of the broad domestic economy through changes in the aggregate market value of 500 stocks representing all major industries.
The Alerian MLP Index is a composite of the 50 most prominent energy master limited partnerships that provides investors with an unbiased, comprehensive benchmark for this emerging asset class. The index, which is calculated using a float-adjusted, capitalization-weighted methodology, is disseminated in real time on a price-return basis (NYSE: AMZ) and on a total-return basis (NYSE: AMZX).
Bloomberg West Texas Intermediate Cushing Crude Oil Price: Bloomberg’s spot crude oil price indications use benchmark WTI crude at Cushing, OK; and other U.S. crude oil grades trade on a price spread differential to WTI, Cushing.
Bloomberg European Dated Brent: The price reflects the average value of Brent contracts for differences over the 10-25 day period. Contracts for differences, or CFDs, are short-term swaps which represent the differential in price between dated BFOE and a forward month cash contract, typically on a weekly basis.
S&P 500 (TR) Oil & Gas Equipment & Services – SUBIND: The index comprises stocks in the S&P 500 Index that are classified in the GICS (Global Industry Classification Standard) oil & gas equipment & services sub-industry.
S&P 500 (TR) Oil & Gas Exploration & Production – SUBIND: The index comprises stocks in the S&P 500 Index that are classified in the GICS (Global Industry Classification Standard) oil & gas exploration & production sub-industry.
S&P 500 (TR) Oil & Gas Refining & Marketing – SUBIND: The index comprises stocks in the S&P 500 Index that are classified in the GICS (Global Industry Classification Standard) oil & gas refining & marketing sub-industry.
S&P 500 (TR) Oil & Gas Drilling – SUBIND: The index comprises stocks in the S&P 500 Index that are classified in the GICS (Global Industry Classification Standard) oil & gas drilling sub-industry.
S&P 500 (TR) Integrated Oil & Gas – SUBIND: The index comprises stocks in the S&P 500 Index that are classified in the GICS (Global Industry Classification Standard) integrated oil & gas sub-industry.
This research material has been prepared by LPL Financial LLC.
To the extent you are receiving investment advice from a separately registered independent investment advisor, please note that LPL Financial is not an affiliate of and makes no representation with respect to such entity.
Not FDIC or NCUA/NCUSIF Insured | No Bank or Credit Union Guarantee | May Lose Value | Not Guaranteed by Any Government Agency | Not a Bank/Credit Union Deposit
Tracking #1-472983 (Exp. 03/17)