Equities Rebound, But Commodity Pressures Persist
Click here to download a PDF of this report.
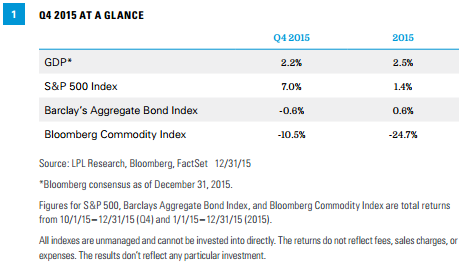
- The U.S. economy has been holding steady as consumer spending and service sector growth compensate for manufacturing weakness. Based on data received so far, fourth quarter real gross domestic product (GDP) growth is tracking at 2.0–2.5%, following 2.0% growth in the third quarter and 3.9% growth in the second. Economic improvement prompted the Federal Reserve (Fed) to announce the first rate hike in almost 10 years at the conclusion of its December 15–16 policy meeting. Further declines in oil prices and a strong dollar continue to weigh on the manufacturing sector, but service sector expansion remains healthy, while job market gains, low gas prices, and improving home values have buoyed consumer spending.
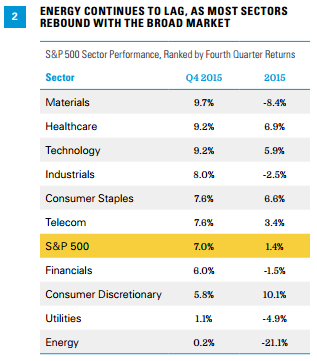
- Stocks post gains in fourth quarter, reclaim positive territory for the year. The S&P 500 Index posted a 7.0% total return during the quarter, recovering from damage caused by a third quarter swoon in investor sentiment induced by weakening emerging economies, continued declines in oil and material prices, uncertainty surrounding the Fed’s plan for rate normalization, and a more difficult backdrop for corporate earnings. Though earnings did decline by -1.6% year over year in the quarter, excluding energy, earnings increased 5.3%. The quarter’s gains helped return the market to positive footing for the year, with a total return for the S&P 500 of 1.4%.
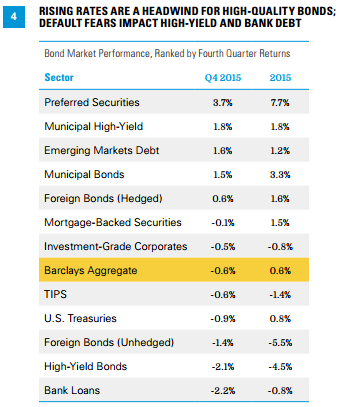
- Bonds have challenging fourth quarter as interest rates rise ahead of Fed liftoff In December. After a strong third quarter, the fourth quarter proved to be challenging for most segments of the fixed income market. Interest rates rose across the maturity spectrum over the quarter, with shorter-term yields rising more than longer-term in anticipation of the first Fed interest rate increase. The headwind of rising interest rates led to a -0.6% return for the Barclays Aggregate, bringing the 2015 total return to 0.6%. The pressure of investor outflows and risk aversion to lower-quality fixed income instruments heading into year-end was a strong headwind for economically sensitive portions of fixed income, evidenced by highyield returning -2.1% and bank loans returning -2.2%. Preferred securities continued to benefit from investor flows out of high-yield and bank loans, contributing to the sector’s standout return of 3.7% over the fourth quarter, despite the sector’s elevated interest rate sensitivity.
- Oil continued its downtrend as no relief was provided by OPEC’s fall meeting. The Bloomberg Commodity Index fell 10.5% in the fourth quarter while the price of WTI crude oil decreased by 17.9% and ended the year with a -30.5% return. The index’s return also was affected by a stronger dollar. OPEC’s (Organization of Petroleum Exporting Countries) decision to not cut supply as well as a slow correction in non-OPEC (specifically U.S.) supply contributed to oil’s fall. Agricultural commodities broadly fell amongst global demand concerns. Precious metals found no positive catalysts and each fell nearly 5% for the quarter.
- Equity market neutral strategies continued to lead gains. The HFRX Equity Market Neutral Index returned 0.9% during the quarter, with many managers seeing healthy profits from their short positions. The struggle for distressed and high-yield related managers continued (HFRX Distressed down 6.7%), as spread widening across the industry persistent. Positions in the energy sector continued to be marked lower, while redemption requests also impacted overall portfolio implementation. Systematic and discretionary macro strategy returns were in a tight range over the course of the quarter. Short commodity contract exposure continued to benefit trend followers; however, quarterly gains were hindered by quarter end losses from long fixed income exposure.
A Look Forward
We expect the U.S. economy will expand at a rate of 2.5–3.0% in 2016,* led by both consumer and business spending. Continued economic growth and operating discipline should continue to benefit earnings growth in sectors beyond energy. Stocks will not collapse as many people think, nor soar as many people hope, but instead may offer near historical routine returns. With the Fed’s posture toward further rate hikes, steady economic growth, and high valuations, bonds offer limited upside, but maintain an important role in portfolios as a diversifier.
For more insight into our forecasts, please see our Outlook 2016: Embrace the Routine.
*As noted in the Outlook 2016, LPL Research expects GDP to expand at a rate of 2.5 to 3.0%, which is near the average growth rate of the past 50 years. This is based larger contributions from manufacturing, business capital spending and net exports.
Bonds are subject to market and interest rate risk if sold prior to maturity.
Bond values and yields will decline as interest rates rise, and bonds are subject to availability and change in price. Commodity-linked investments may be more volatile and less liquid than the underlying instruments or measures, and their value may be affected by the performance of the overall commodities baskets as well as weather, geopolitical events, and regulatory developments.
Alternative strategies may not be suitable for all investors. The management of alternative investments may accelerate the velocity of potential losses.
Asset class returns are represented by the returns of indexes and are not ranked on an annual total return basis. It is not possible to invest directly in an index so these are not actual results an investor would achieve.
Bond Market Asset Class Indexes: Foreign Bonds (hedged) – Citigroup Non-U.S. World Government Bond Index Hedged for Currency; Preferred Securities – Merrill Lynch Preferred Stock Hybrid Securities Index; Treasury – Barclays U.S. Treasury Index; Mortgage-Backed Securities – Barclays U.S. MBS Index; Investment-Grade Corporate – Barclays U.S. Corporate Bond Index; Municipal – Barclays Municipal Bond Index; Municipal High-Yield – Barclays Municipal High Yield Index; TIPS – Barclays Treasury Inflation-Protected Securities Index; Bank Loans – Barclays U.S. High Yield Loan Index; High-Yield – Barclays U.S. Corporate High Yield Index; Emerging Market Debt – JP Morgan Emerging Markets Global Index; Foreign Bonds (unhedged) – Citigroup Non-U.S. World Government Bond Index (unhedged)
Sources: LPL Research, FactSet 12/31/15
All indexes are unmanaged and cannot be invested into directly. The returns do not reflect fees, sales charges, or expenses. The results don’t reflect any particular investment. Past performance is no guarantee of future results.
Because of its narrow focus, sector investing will be subject to greater volatility than investing more broadly across many sectors and companies.
The sectors are represented by the 10 S&P 500 Global Industry Classification Standard (GICS) indexes.
Asset classes based on Russell 1000, Russell 3000 Growth and Value Indexes, Russell 2000, Russell Midcap Index, MSCI EAFE, MSCI Emerging Markets Index.
IMPORTANT DISCLOSURES
The opinions voiced in this material are for general information only and are not intended to provide specific advice or recommendations for any individual. To determine which investment(s) may be appropriate for you, consult your financial advisor prior to investing. All performance reference is historical and is no guarantee of future results. All indexes are unmanaged and cannot be invested into directly.
General Stock & Debt Equity Risks
Stock investing may involve risk including loss of principal.
Investing in foreign and emerging markets securities involves special additional risks. These risks include, but are not limited to, currency risk, geopolitical risk, and risk associated with varying accounting standards. Investing in emerging markets may accentuate these risks.
There is no guarantee that a diversified portfolio will enhance overall returns or outperform a nondiversified portfolio. Diversification does not ensure against market risk.
Government bonds and Treasury bills are guaranteed by the U.S. government as to the timely payment of principal and interest and, if held to maturity, offer a fixed rate of return and fixed principal value. However, the value of fund shares is not guaranteed and will fluctuate.
High-yield/junk bonds are not investment-grade securities, involve substantial risks, and generally should be part of the diversified portfolio of sophisticated investors.
Long/short equity funds are subject to normal alternative investment risks, including potentially higher fees; while there is additional management risk, as the manager is attempting to accurately anticipate the likely movement of both their long and short holdings. There is also the risk of “beta-mismatch,” in which long positions could lose more than short positions during falling markets.
Definitions
An organization consisting of the world’s major oil-exporting nations. The Organization of Petroleum Exporting Countries (OPEC) was founded in 1960 to coordinate the petroleum policies of its members, and to provide member states with technical and economic aid. OPEC is a cartel that aims to manage the supply of oil in an effort to set the price of oil on the world market, in order to avoid fluctuations that might affect the economies of both producing and purchasing countries.
Gross domestic product (GDP) is the monetary value of all the finished goods and services produced within a country’s borders in a specific time period, though GDP is usually calculated on an annual basis. It includes all of private and public consumption, government outlays, investments, and exports less imports that occur within a
defined territory.
Risk-on risk-off refers to changes in investment activity in response to global economic patterns. During periods when risk is perceived as low, risk-on risk-off theory states that investors tend to engage in higher-risk investments. When risk is perceived as high, investors have the tendency to gravitate toward lower-risk investments.
Index Definitions
The Barclays U.S. Corporate High Yield Index measures the market of USD-denominated, noninvestment grade, fixed-rate, taxable corporate bonds. Securities are classified as high yield if the middle rating of Moody’s, Fitch, and S&P is Ba1/BB+/BB+ or below, excluding emerging markets debt.
The Barclays U.S. High Yield Loan Index tracks the market for dollar-denominated floating-rate leveraged loans. Instead of individual securities, the U.S. High-Yield Loan Index is composed of loan tranches that may contain multiple contracts at the borrower level.
The Barclays U.S. Aggregate Bond Index is a broad-based flagship benchmark that measures the investment-grade, U.S. dollar-denominated, fixed-rate taxable bond market. The index includes Treasuries, government-related and corporate securities, MBS (agency fixed-rate and hybrid ARM pass-throughs), ABS, and CMBS (agency and non-agency).
The Barclays U.S. Corporate Index is a broad-based benchmark that measures the investment-grade, U.S. dollar-denominated, fixed-rate, taxable corporate bond market.
The Barclays U.S. Treasury Index is an unmanaged index of public debt obligations of the U.S. Treasury with a remaining maturity of one year or more. The index does not include T-bills (due to the maturity constraint), zero coupon bonds (strips), or Treasury Inflation-Protected Securities (TIPS).
The Barclays U.S. Mortgage Backed Securities (MBS) Index tracks agency mortgage backed pass-through securities (both fixed rate and hybrid ARM) guaranteed by Ginnie Mae (GNMA), Fannie Mae (FNMA), and Freddie Mac (FHLMC).
The Barclays U.S. Treasury TIPS Index is a rules-based, market value-weighted index that tracks inflation-protected securities issued by the U.S. Treasury.
The BofA Merrill Lynch Preferred Stock Hybrid Securities Index is an unmanaged index consisting of a set of investment-grade, exchange-traded preferred stocks with outstanding market values of at least $50 million that are covered by Merrill Lynch Fixed Income Research.
The Bloomberg Commodity Index is calculated on an excess return basis and composed of futures contracts on 22 physical commodities. It reflects the return of underlying commodity futures price movements.
The HFRX Distressed Restructuring Index strategies employ an investment process focused on corporate fixed income instruments, primarily on corporate credit instruments of companies trading at significant discounts to their value at issuance or obliged (par value) at maturity as a result of either formal bankruptcy proceeding or financial market perception of near term proceedings. Managers are typically actively involved with the management of these companies, frequently involved on creditors’ committees in negotiating the exchange of securities for alternative obligations, either swaps of debt, equity or hybrid securities. Managers employ fundamental credit processes focused on valuation and asset coverage of securities of distressed firms; in most cases portfolio exposures are concentrated in instruments which are publicly traded, in some cases actively and in others under reduced liquidity but in general for which a reasonable public market exists. In contrast to Special Situations, Distressed Strategies employ primarily debt (greater than 60%) but also may maintain related equity exposure.
The HFRX Equity Market Neutral Index strategies employ sophisticated quantitative techniques of analyzing price data to ascertain information about future price movement and relationships between securities, select securities for purchase and sale. These can include both factor-based and statistical arbitrage/trading strategies. Factor-based investment strategies include strategies in which the investment thesis is predicated on the systematic analysis of common relationships between securities. In many but not all cases, portfolios are constructed to be neutral to one or multiple variables, such as broader equity markets in dollar or beta terms, and leverage is frequently employed to enhance the return profile of the positions identified. Statistical arbitrage/trading strategies consist of strategies in which the investment thesis is predicated on exploiting pricing anomalies that may occur as a function of expected mean reversion inherent in security prices; high frequency techniques may be employed and trading strategies may also be employed on the basis on technical analysis or opportunistically to exploit new information the investment manager believes has not been fully, completely, or accurately discounted into current security prices. Equity market neutral strategies typically maintain characteristic net equity market exposure no greater than 10% long or short.
The JP Morgan Emerging Markets Bond Index is a benchmark index for measuring the total return performance of international government bonds issued by emerging markets countries that are considered sovereign (issued in something other than local currency) and that meet specific liquidity and structural requirements.
The Russell 1000 Index measures the performance of the large-cap segment of the U.S. equity universe. It is a subset of the Russell 3000 Index and includes approximately 1000 of the largest securities based on a combination of their market cap and current index membership. The Russell 1000 represents approximately 92% of the U.S. market.
The Russell Midcap Index offers investors access to the mid cap segment of the U.S. equity universe. The Russell Midcap Index is constructed to provide a comprehensive and unbiased barometer for the mid cap segment and is completely reconstituted annually to ensure that larger stocks do not distort the performance and characteristics of the true mid cap opportunity set. The Russell Midcap Index includes the smallest 800 securities in the Russell 1000.
The Russell 2000 Index measures the performance of the small cap segment of the U.S. equity universe. The Russell 2000 Index is a subset of the Russell 3000 Index representing approximately 10% of the total market capitalization of that index.
The Russell 3000 Growth Index measures the performance of the broad growth segment of the U.S. equity universe. It includes those Russell 3000 companies with higher price-to-book ratios and higher forecasted growth values.
The Russell 3000 Value Index measures the performance of the broad value segment of U.S. equity value universe. It includes those Russell 3000 companies with lower price-to-book ratios and lower forecasted growth values.
The MSCI EAFE Index is recognized as the pre-eminent benchmark in the United States to measure international equity performance. It comprises the MSCI country indexes that represent developed markets outside of North America: Europe, Australasia, and the Far East.
The MSCI Emerging Markets Index captures large and mid cap representation across 23 emerging markets (EM) countries. With 822 constituents, the index covers approximately 85% of the free float-adjusted market capitalization in each country.
The S&P 500 Index is a capitalization-weighted index of 500 stocks designed to measure performance of the broad domestic economy through changes in the aggregate market value of 500 stocks representing all major industries.
The Barlcays U.S. Municipal Index covers the USD-denominated, long-term, tax-exempt bond market. The index has four main sectors: state and local general obligation bonds, revenue bonds, insured bonds, and prerefunded bonds.
The Barclays Municipal High Yield Bond Index is comprised of bonds with maturities greater than one-year, having a par value of at least $3 million issued as part of a transaction size greater than $20 million, and rated no higher than ‘BB+’ or equivalent by any of the three principal rating agencies.
The Citigroup Non-U.S. World Government Bond Hedged Index measures the performance of fixed-rate, local currency, investment grade sovereign bonds. This index is a widely used benchmark that currently comprises sovereign debt from over 20 countries, denominated in a variety of currencies, and has more than 25 years of history available. It provides a broad benchmark for the global sovereign fixed income market, excluding the U.S., with currencies hedged against the U.S. dollar
This research material has been prepared by LPL Financial.
To the extent you are receiving investment advice from a separately registered independent investment advisor, please note that LPL Financial is not an affiliate of and makes no representation with respect to such entity.
Not FDIC or NCUA/NCUSIF Insured | No Bank or Credit Union Guarantee | May Lose Value | Not Guaranteed by Any Government Agency | Not a Bank/Credit Union Deposit
Tracking #1-454677 (Exp. 05/16)