STOCKS EKED OUT MODEST GAINS IN TOUGH QUARTER FOR THE BOND MARKET
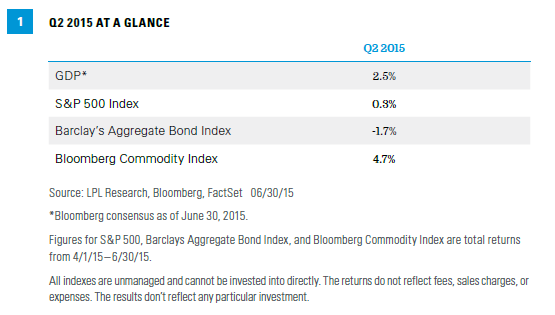
- Economic growth saw a bounce back in the second quarter, after “transitory factors” hurt growth in the first quarter. This bounce back was muted, however, as the stronger dollar and energy-related capital spending cuts that hurt first quarter activity lingered into the second quarter. The labor market got back on track in the second quarter, keeping the Federal Reserve (Fed) on course to begin hiking rates in late 2015. Overseas, the monetary policy stimulus in Japan, the Eurozone, and China continues to support growth, but uncertainty over Greece could be a drag moving forward.
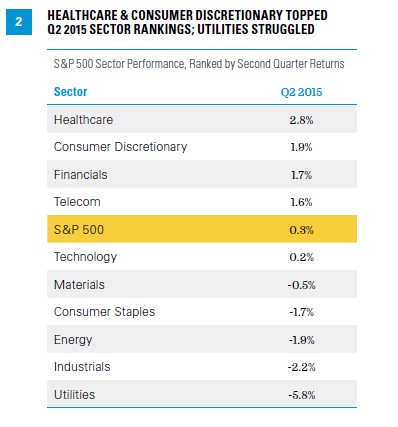
- Stocks eked out 10th consecutive quarterly gain. The S&P 500 produced its 10th straight positive quarter during the second quarter of 2015, though with only a meager 0.3% total return. After evidence of a U.S. economic snapback helped drive gains throughout much of the quarter, stocks nearly surrendered all of those gains late in the quarter when concerns about a potential Greek exit from the Eurozone, a possible stock market bubble in mainland China, and a possible Puerto Rico default all contributed to a 1.9% drop for the S&P 500 in June. Second quarter gains brought the S&P 500’s total return for the first half of 2015 to 1.2%.
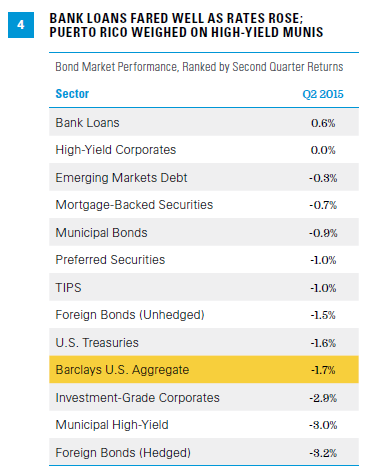
- Quarterly winning streak for bonds was broken. The second quarter of 2015 marked the first quarterly loss for the Barclays U.S. Aggregate Bond Index since the fourth quarter of 2013. The index posted a total return of -1.7% for the quarter, bringing the year-to-date total return into the red (-0.1%) for the first half of 2015. Interest rates rose modestly during the quarter on improving domestic economic data. Renewed Greek concerns and a dovish Fed meeting helped to halt the rise in interest rates late in the quarter.
- Oil bounced back as imbalances began to correct. The Bloomberg Commodity Index was a beneficiary of a rebound in oil prices and gained 4.7% on the quarter. Oil benefited primarily from planned production cuts and falling rig counts as the energy market made some progress toward rebalancing supply with demand. The powerful U.S. dollar rally reversed course during the quarter, which also aided the commodity complex. Grains enjoyed broad gains as persistent rains across the Midwest called into question the quality of harvests. Gold was virtually flat for the quarter while silver fell modestly and copper struggled with China growth fears.
- Event driven strategies led gains, while trend following encountered a sharp reversal. During the quarter, merger arbitrage paced the broader event driven category, while less directional equity strategies were best able to weather the late quarter sell-off. After leading alternative strategy returns for much of the last year, trend following managed futures managers saw their first quarter returns erased, as many of their model-based signals were whipsawed due to sideways trading patterns.

Click here to download a PDF of this report.
A LOOK FORWARD
We expect the U.S. economy will expand at a rate of 3% in 2015,* led by both consumer and business spending, which would be the highest annual advance since 2010. Tempered by increasing levels of volatility, stocks are poised to advance mid- to high-single-digits on the back of steady earnings growth. Battling the dual threats of the Fed’s impending rise in rates and expanding economic growth, we believe bonds offer very limited return potential in 2015.
For more insight into our forecasts, please see our Midyear Outlook 2015: Some Assembly Required.
* As noted in the Outlook 2015, LPL Research expects GDP to expand at a rate of 3% or higher, which matches the average growth rate of the past 50 years. This is based on contributions from consumer spending, business capital spending, and housing, which are poised to advance at historically average or better growth rates in 2015. Net exports and the government sector should trail behind.
Commodity-linked investments may be more volatile and less liquid than the underlying instruments or measures, and their value may be affected by the performance of the overall commodities baskets as well as weather, geopolitical events, and regulatory developments.
THE NEW MARKET INSIGHT QUARTERLY & MARKET INSIGHT MONTHLY
The updated quarterly edition of Market Insight provides a high-level overview of what occurred in the economy, stock and bond markets, commodities, and alternative strategies during the previous quarter. For more detailed performance data and commentary, we provide a monthly review in the new Market Insight Monthly publication.
Access past issues of the Market Insight Monthly on the Resource Center, or here:


Asset class returns are represented by the returns of indexes and are not ranked on an annual total return basis. It is not possible to invest directly in an index so these are not actual results an investor would achieve.
Bond Market Asset Class Indexes: Foreign Bonds (hedged) – Citigroup Non-U.S. World Government Bond Index Hedged for Currency; Preferred Securities – Merrill Lynch Preferred Stock Hybrid Securities Index; Treasury – Barclays U.S. Treasury Index; Mortgage-Backed Securities – Barclays U.S. MBS Index; Investment-Grade Corporate – Barclays U.S. Corporate Bond Index; Municipal – Barclays Municipal Bond Index; Municipal High-Yield – Barclays Municipal High-Yield Index; TIPS – Barclays Treasury Inflation-Protected Securities Index; Bank Loans – Barclays U.S. High-Yield Loan Index; High-Yield – Barclays U.S. Corporate High- Yield Index; Emerging Market Debt – JP Morgan Emerging Markets Global Index; Foreign Bonds (unhedged) – Citigroup Non-U.S. World Government Bond Index (unhedged)
Sources: LPL Research, FactSet 06/30/15
All indexes are unmanaged and cannot be invested into directly. The returns do not reflect fees, sales charges, or expenses. The results don’t reflect any particular investment. Past performance is no guarantee of future results.
Because of its narrow focus, sector investing will be subject to greater volatility than investing more broadly across many sectors and companies.
The sectors are represented by the 10 S&P 500 Global Industry Classification Standard (GICS) indexes.
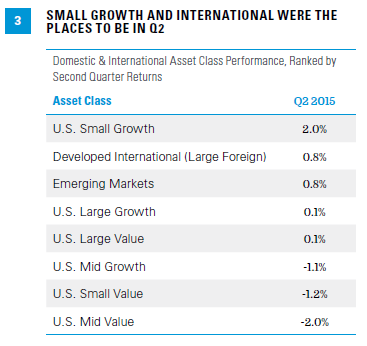
Asset classes based on Russell 1000, Russell 3000 Growth and Value Indexes, Russell 2000, Russell Midcap Index, MSCI EAFE, MSCI Emerging Markets Index.
IMPORTANT DISCLOSURES
The opinions voiced in this material are for general information only and are not intended to provide specific advice or recommendations for any individual. To determine which investment(s) may be appropriate for you, consult your financial advisor prior to investing. All performance reference is historical and is no guarantee of future results. All indexes are unmanaged and cannot be invested into directly.
Past performance is not indicative of future results.
The economic forecasts set forth in the presentation may not develop as predicted.
Stock investing entails risk including loss of principal.
Bonds are subject to market and interest rate risk if sold prior to maturity.
Bond values and yields will decline as interest rates rise, and bonds are subject to availability and change in price.
Alternative strategies may not be suitable for all investors. The management of alternative investments may accelerate the velocity of potential losses.
Commodity-linked investments may be more volatile and less liquid than the underlying instruments or measures, and their value may be affected by the performance of the overall commodities baskets as well as weather, geopolitical events, and regulatory developments.
Gross domestic product (GDP) is the monetary value of all the finished goods and services produced within a country’s borders in a specific time period, though GDP is usually calculated on an annual basis. It includes all of private and public consumption, government outlays, investments, and exports less imports that occur within a defined territory.
The S&P 500 Index is a capitalization-weighted index of 500 stocks designed to measure performance of the broad domestic economy through changes in the aggregate market value of 500 stocks representing all major industries.
The Barclays U.S. Aggregate Bond Index is a broad-based flagship benchmark that measures the investment-grade, U.S. dollar-denominated, fixed-rate taxable bond market. The index includes Treasuries, government-related and corporate securities, MBS (agency fixed-rate and hybrid ARM pass-throughs), ABS, and CMBS (agency and non-agency).
The Bloomberg Commodity Index is calculated on an excess return basis and composed of futures contracts on 22 physical commodities. It reflects the return of underlying commodity futures price movements.
This research material has been prepared by LPL Financial.
To the extent you are receiving investment advice from a separately registered independent investment advisor, please note that LPL Financial is not an affiliate of and makes no representation with respect to such entity.
Not FDIC or NCUA/NCUSIF Insured | No Bank or Credit Union Guarantee | May Lose Value | Not Guaranteed by Any Government Agency | Not a Bank/Credit Union Deposit
Tracking #1-399194 (Exp. 11/15)
