MARCH 2016 IN REVIEW
Click here to download a PDF of this report.
ECONOMY: SLOW BUT STEADY U.S. ECONOMIC GROWTH
Economic Data
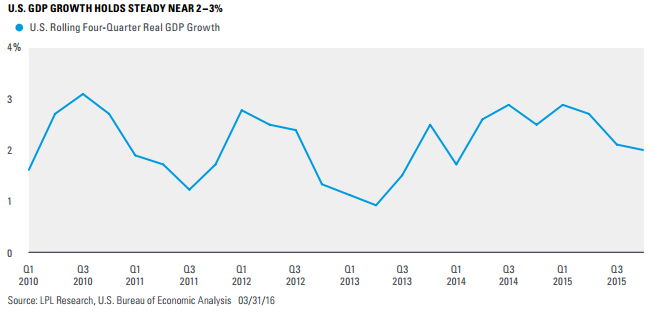
U.S. economic data released in March, which largely capture economic activity in February, pointed to fairly steady but below-trend economic growth in the U.S. Nevertheless, the overall picture of the economy strengthened based on substantial improvement in market-based indicators of economic risk such as high-yield bond spreads and the level of the VIX Index (a measure of market volatility). These improvements were, in part, driven by a strong rebound in oil prices and a market-friendly outcome of the Federal Reserve’s (Fed) March policy meeting, as well as a better export environment due to a stabilizing U.S. dollar. While economic surprises tilted positive overall compared to consensus expectations, the margin was not large. Healthy consumer- and services based segments of the economy continue to outpace manufacturing- and exports-based segments, although several measures of manufacturing activity did show improvement in February from modestly depressed levels. U.S. real gross domestic product (GDP) growth for the fourth quarter of 2015 was revised upward in March to an annualized 1.4% from a prior estimate of 0.7%, driven mostly by upward revisions for consumer spending and exports.
Labor markets continue to provide a positive backdrop for consumers. The economy created 242,000 jobs in February, handily topping expectations. The only negative in a very strong overall report was a slight decline in average hourly earnings. Advance monthly retail sales data for February fell but still came in above consensus, although strong downward revisions to January’s data gave the report a negative slant. Personal income and outlays data reinforced the impression from hourly earnings and retail sales, coming in largely in-line with somewhat weak expectations. Slower growth in consumer spending is reflected in a three-year high in the February savings rate, as consumers continue to use an improved labor market and low gas prices to firm up balance sheets.
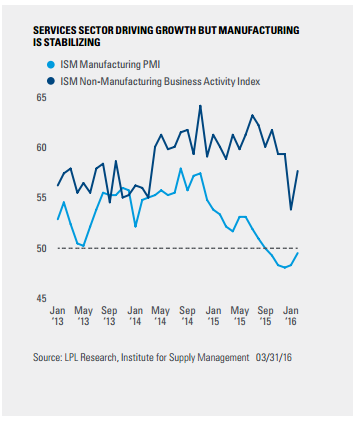
While manufacturing activity, as measured by the Institute for Supply Management’s (ISM) manufacturing Purchasing Managers’ Index (PMI), continued to contract in February, the pace of contraction slowed for the second consecutive month and the headline number solidly topped consensus expectations to the upside. The report’s new orders index, an important leading sub-component of the PMI, showed expansion for the second consecutive month. Although ISM’s broad non-manufacturing index composite, which reflects the services sector, has weakened, it remains solidly in expansionary territory. Strength in the Business Activity Index, a proxy for output, rose 4 points to 57.8, reflecting the importance of the “know-how” economy to U.S. economic growth.
Central Banks
As the March meeting of the Fed’s policy arm, the Federal Open Market Committee (FOMC), approached, the main question for market participants was whether the gap between market expectations of two more 25 basis point (0.25%) rate hikes over the course of 2016 and the Fed’s expectation of four hikes expressed at its December 2015 meeting would close. In what could be considered a mildly accommodative move, Fed expectations fell in-line with the market’s expectations of two rate hikes. In addition, longrun “neutral” fed funds expectations were reduced by 25 basis points (0.25%). In the FOMC’s policy statement, the committee cited global economic weakness and tighter financial conditions as the justification for maintaining a slower, but still data dependent, rate hike path, while still talking up the U.S. economy. In her comments at the press conference following the conclusion of the meeting, Fed Chair Janet Yellen further elaborated that every FOMC meeting this year will be a live meeting and that the FOMC is not considering negative rates.
The European Central Bank (ECB) also made a splash in March following its March 10 policy meeting, cutting all three of its key interest rates and moving the deposit rate 10 basis points (0.1%) lower to -0.4%. It also announced it would increase its quantitative easing program from 60 billion euros per month to 80 billion and would expand the assets eligible for purchase to include corporate bonds. The ECB did not, as some had expected, expand the time frame of the program, which is slated to end a year from now in March 2017.
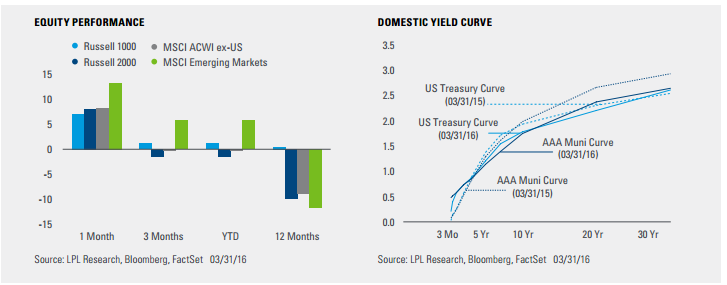
GLOBAL EQUITIES: U.S. EQUITIES SUSTAIN RALLY, REGAIN POSITIVE TERRITORY FOR 2016 U.S.
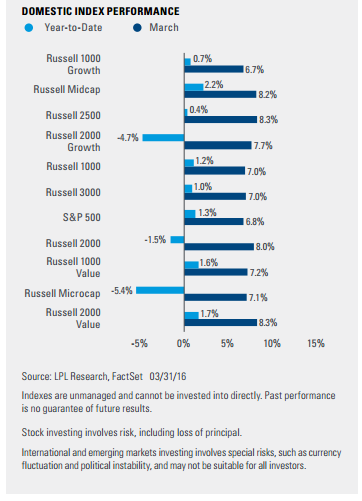
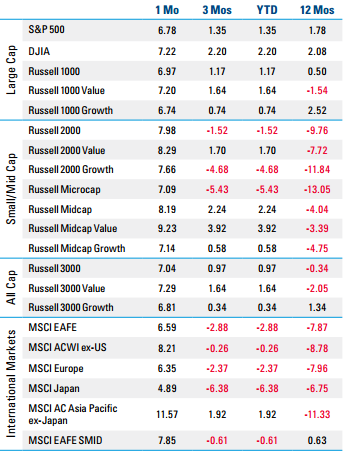
Domestic equity markets posted their first positive month of 2016, breaking a streak of three consecutive months of negative total returns. On the month, the S&P 500 posted a total return of 6.8%, bringing year-to-date total return into positive territory at 1.3%. The rally was driven by continued stability in the commodity complex and an improvement in investor sentiment, which was complemented by continued economic improvements, particularly in the labor market. Additionally, the Fed reiterated its commitment to erring on the side of policy stability in the face of potential global headwinds. This dovish posture helped to alleviate fears the Fed may move too quickly toward rate normalization and extinguish the continued, albeit tepid recovery of the U.S. economy.
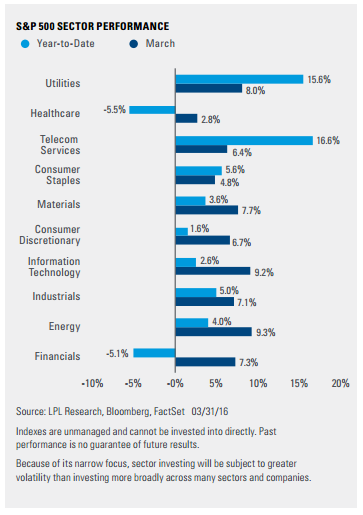
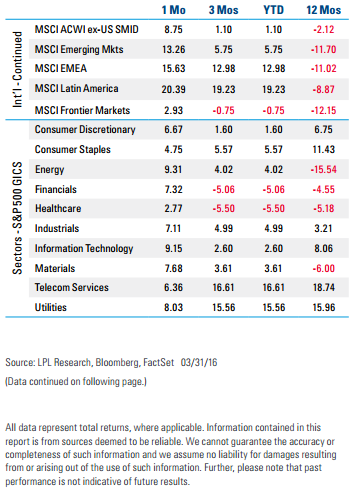
Sector performance continued to be somewhat confounding, as traditionally defensive sectors such as telecom and utilities were strong performers at 6.4% and 8.0%, respectively. The recovery in commodity prices and lack of appreciation in the U.S. dollar continued to support industrials (7.1%), materials (7.7%), and energy (9.3%). While economic activity—particularly for the U.S. consumer—remained robust, the performance of other sectors was a bit mixed as technology (9.2%) and financials (7.3%) outperformed the market, while consumer discretionary (6.7%), consumer staples (4.8%), and healthcare (2.8%) lagged.
International
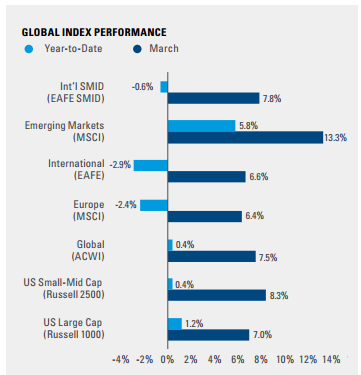
International stocks, as represented by the MSCI EAFE Index (foreign developed) and MSCI Emerging Markets Index, both posted gains of 6.6% and 13.3%, respectively. Despite the rally, foreign developed stocks continue to lag their domestic counterparts on a year-to-date basis and remain in the red with a total return of -2.9%. The strength of the emerging markets rally has resulted in strong relative performance versus domestic stocks and resulted in a positive year-to-date performance of 5.8%. During the month, the ECB continued to move further into the realm of nontraditional monetary policy by expanding both the size and scope of its quantitative easing program. This move, coupled with continued patience by the Fed was a boon for growth-sensitive emerging economies.
FIXED INCOME: ECONOMICALLY SENSITIVE SECTORS RALLY AS ECONOMIC DATA IMPROVE, RECESSION FEARS FADE
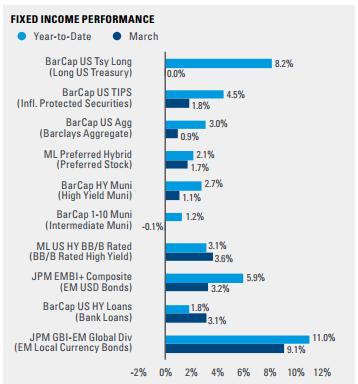
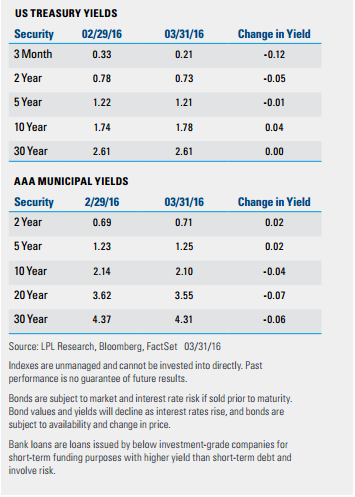
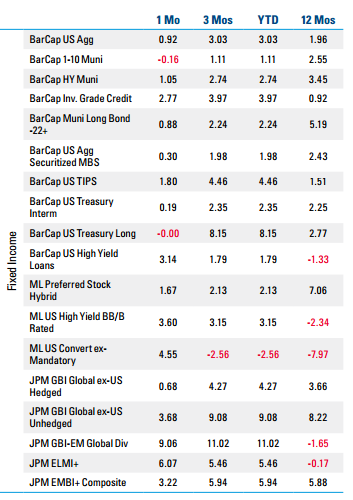
Treasury yields were roughly unchanged during March after declining during the first two months of the year. The only notable change in yields occurred among shorter maturities as yields declined due to dovish comments from Fed Chair Yellen, which served to reduce Fed rate hike expectations. A rebound in oil prices and dovish comments from Yellen gave Treasury Inflation-Protected Securities (TIPS) a boost. Yellen’s comments suggested the Fed may be willing to accept higher inflation before raising rates. TIPS rallied as a result, returning 1.8% during March, outperforming Treasuries and the broader fixed income market (represented by the Barclays Treasury and Barclays Aggregate Indexes), which gained 0.2% and 0.9%, respectively.
Economically sensitive sectors were the major beneficiary of the market’s rekindled appetite for risk. Higher oil prices also helped as WTI crude oil remained above $35 per barrel for most of the month. Opportunistic investors, realizing that credit spreads were implying overly pessimistic default and recession probabilities, continued the rally in lower-quality fixed income that began in mid-February. High-yield returned 3.6% on this strength, emerging markets debt 3.2%, and bank loans 3.1%. Investment-grade corporate bonds rallied as well, returning 2.8% during March. U.S. dollar weakness was a positive for unhedged foreign bonds during March, boosting the sector to a strong 3.7% return for the month.
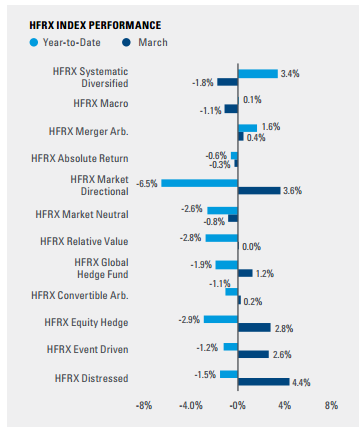
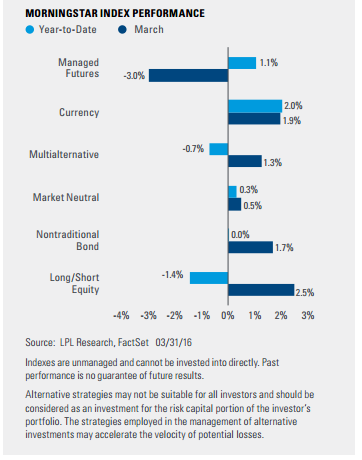
ALTERNATIVES: DISTRESSED DEBT RALLY
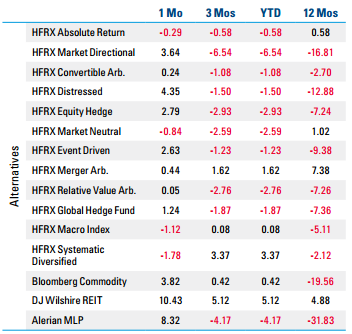
As measured by the HFRX Equity Hedge Index, more directionally sensitive equity strategies were positive (2.8%); however, they trailed traditional benchmarks (S&P 500 returned 6.8%) on both an absolute and risk-adjusted basis. Entering the month, managers across the long/short space were conservatively positioned given the significant selling pressure experienced during the first six weeks of the year. While this helped mitigate downside risk at the time, many strategies maintained these lower gross and net market exposures even as equity markets swiftly rallied throughout March. A noteworthy portion of this decline in exposure has been a reduction in long healthcare positioning across the hedge fund industry. Further, with the broad-based equity gains, it was difficult for managers to add alpha on the short-side of the portfolio, as short holdings predominantly acted as a headwind throughout the month.
On the positive side, given the risk-on sentiment, distressed strategies, as measured by the HFRX Distressed Index, delivered a robust return of 4.4%, the index’s first monthly gain since October 2015 and the largest since January 2015. Several managers were further supported by news out of Argentina, stating that holdout creditors from the country’s 2001 default would be offered a settlement payment.
Following two straight months of impressive gains, systematic macro strategies suffered a reversal in performance, as the HFRI Systematic Diversified Index declined 1.8%. Short exposure to oil, sugar, and natural gas contracts all weighed on returns, as the previous trends in those commodities quickly reversed during the month, leading to portfolio losses. Many strategies implementing short-term trend models were able to partially offset these losses, profiting from the positive short-term reversal in the equity market.
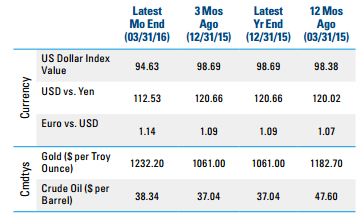
REAL ASSETS SHOW BROAD-BASED STRENGTH IN MARCH
Following through on the “risk” rally beginning in midFebruary, real assets broadly posted strong returns in March. A weaker U.S. dollar aided performance as well with the Trade-Weighted U.S. Dollar Index down 3.6%. The Bloomberg Commodity Index returned 3.8% as most constituents ended the month with positive performance. Gold and silver ended the month positive with returns of 0.1% and 3.7%, respectively.
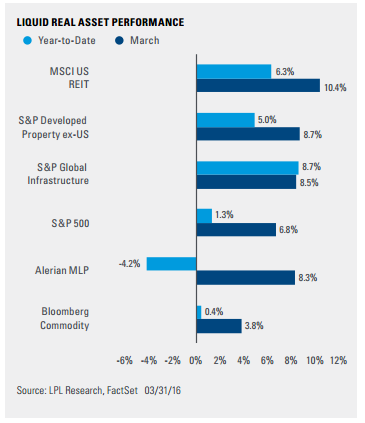
MLPs & Global Listed Infrastructure
Master limited partnerships (MLP) cashed in on oil’s rally and ended the month with an 8.3% return (for the Alerian MLP Total Return Index). Some uncertainty existed to start the month as a bankrupt exploration and production company saw a bankruptcy court rule that certain midstream contracts could be rejected. The index fell by more than 6% on the day this news broke, but was able to recover and end the month strong. The consensus view on this bankruptcy ruling is that midstream companies may now be more inclined to proactively renegotiate contracts with customers, especially those in the exploration and production business. Ultimately, midstream assets in many cases are built specifically for certain customers and, in turn, these customers may only have one option of whom they choose as their midstream provider. This mitigates some of the concern of further bankruptcy rulings for the asset class overall.
Global listed infrastructure, as measured by the S&P Global Infrastructure Index, performed strongly in March and returned 8.5%.
REITs
Rates rose modestly in March, yet real estate investment trusts (REIT) were unfazed, as shown by the MSCI U.S. REIT Index’s return of 10.4%. The index opened up the month with a bang, returning greater than 2% on the first day of March, and never looked back. Perhaps dovish comments from Fed Chair Yellen late in the month helped performance as well. Industrial REITs outperformed while hotel and resort REITs underperformed.
Commodities
WTI crude oil finished the month up 13.6% while Brent crude was up 10.3%. An upcoming production freeze summit in April looms on the horizon and may have major impacts for prices. Natural gas bounced back and returned 14.5%. Copper continued its run and returned 2.4%. Agricultural commodities, helped by a stronger Brazilian real and weaker U.S. dollar, bucked their downward trend and posted their first positive month since October as the Bloomberg Agriculture Subindex returned 4.4%.
Monthly Performance Report
IMPORTANT DISCLOSURES
The economic forecasts set forth in the presentation may not develop as predicted. The opinions voiced in this material are for general information only and are not intended to provide or be construed as providing specific investment advice or recommendations for any individual security. There is no assurance that the techniques and strategies discussed are suitable for all investors or will yield positive outcomes. The purchase of certain securities may be required to affect some of the strategies.
Stock and Pooled Investment Risks
There is no guarantee that a diversified portfolio will enhance overall returns or outperform a non-diversified portfolio. Diversification does not ensure against market risk.
Investments in specialized industry sectors have additional risks, which are outlined in the prospectus. Please read the fund’s prospectus for more information onrisks, fees, and other important information.
Bond and Debt Equity Risks
Government bonds and Treasury bills are guaranteed by the U.S. government as to the timely payment of principal and interest and, if held to maturity, offer a fixed rate of return and fixed principal value. However, the value of fund shares is not guaranteed and will fluctuate.
High-yield/junk bonds are not investment-grade securities, involve substantial risks, and generally should be part of the diversified portfolio of sophisticated investors.
Investing in foreign and emerging markets debt securities involves special additional risks. These risks include, but are not limited to, currency risk, geopolitical and regulatory risk, and risk associated with varying settlement standards.
Municipal bonds are subject to availability, price, and to market and interest rate risk if sold prior to maturity. Bond values will decline as interest rate rise. Interest income may be subject to the alternative minimum tax. Federally tax-free but other state and local taxes may apply.
Treasury Inflation-Protected Securities (TIPS) help eliminate inflation risk to your portfolio, as the principal is adjusted semiannually for inflation based on the Consumer Price Index (CPI)—while providing a real rate of return guaranteed by the U.S. government. However, a few things you need to be aware of is that the CPI might not accurately match the general inflation rate; so the principal balance on TIPS may not keep pace with the actual rate of inflation. The real interest yields on TIPS may rise, especially if there is a sharp spike in interest rates. If so, the rate of return on TIPS could lag behind other types of inflation-protected securities, like floating rate notes and T-bills. TIPS do not pay the inflation-adjusted balance until maturity, and the accrued principal on TIPS could decline, if there is deflation.
Alternative Risks
Currency risk is a form of risk that arises from the change in price of one currency against another. Whenever investors or companies have assets or business operations across national borders, they face currency risk if their positions are not hedged.
Investing in real estate/REITs involves special risks such as potential illiquidity and may not be suitable for all investors. There is no assurance that the investment objectives of this program will be attained.
Investing in MLPs involves additional risks as compared with the risks of investing in common stock, including risks related to cash flow, dilution, and voting rights.
MLPs may trade less frequently than larger companies due to their smaller capitalizations, which may result in erratic price movement or difficulty in buying or selling. MLPs are subject to significant regulation and may be adversely affected by changes in the regulatory environment, including the risk that an MLP could lose its tax status as a partnership. Additional management fees and other expenses are associated with investing in MLP funds.
Long/short equity funds are subject to normal alternative investment risks, including potentially higher fees; while there is additional management risk, as the manager is attempting to accurately anticipate the likely movement of both their long and short holdings. There is also the risk of “beta-mismatch,” in which long positions could lose more than short positions during falling markets.
Global macro strategies attempt to profit from anticipated price movements in stock markets, interest rates, foreign exchange and physical commodities. Global macro risks include but are not limited to imperfect knowledge of macro events, divergent movement from macro events, loss of principal, and related geopolitical risks.
Event driven strategies, such as merger arbitrage, consist of buying shares of the target company in a proposed merger and fully or partially hedging the exposure to the acquirer by shorting the stock of the acquiring company or other means. This strategy involves significant risk as events may not occur as planned and disruptions to a planned merger may result in significant loss to a hedged position.
DEFINITIONS
Different agencies employ different rating scales for credit quality. Standard & Poor’s (S&P) and Fitch both use scales from AAA (highest) through AA, A, BBB, BB, B, CCC, CC, C to D(lowest). Moody’s uses a scale from Aaa (highest) through Aa, A, Baa, Ba, B, Caa, Ca to C (lowest).
The U.S. Institute for Supply Managers (ISM) manufacturing index is an economic indicator derived from monthly surveys of private sector companies, and is intended to show the economic health of the U.S. manufacturing sector. A PMI of more than 50 indicates expansion in the manufacturing sector, a reading below 50 indicates contraction, and a reading of 50 indicates no change.
Purchasing Managers’ Indexes (PMI) are economic indicators derived from monthly surveys of private sector companies, and are intended to show the economic health of the manufacturing sector. A PMI of more than 50 indicates expansion in the manufacturing sector, a reading below 50 indicates contraction, and a reading of 50 indicates no change. The two principal producers of PMIs are Markit Group, which conducts PMIs for over 30 countries worldwide, and the Institute for Supply Management (ISM), which conducts PMIs for the US.
Monetary policy is the process through which the monetary authority (central bank, currency board, or other regulatory committee) of a country controls the size and rate of growth of the money supply, which in turn affects interest rates.
Global Industry Classification Standard (GICS): A standardized classification system for equities developed jointly by Morgan Stanley Capital International (MSCI) and Standard & Poor’s. The GICS methodology is used by the MSCI indexes, which include domestic and international stocks, as well as by a large portion of the professional investment management community. The GICS hierarchy begins with 10 sectors and is followed by 24 industry groups, 67 industries and 147 sub-industries. Each stock that is classified will have a coding at all four of these levels. The 10 GIC Sectors are as follows: Energy, Materials, Industrials, Consumer Discretionary, Consumer Staples, Health Care, Financials, Information Technology, Telecommunication Services, and Utilities.
The Federal Open Market Committee (FOMC) is the branch of the Federal Reserve Board that determines the direction of monetary policy. The eleven-person FOMC is composed of the seven-member board of governors, and the five Federal Reserve Bank presidents. The president of the Federal Reserve Bank of New York serves continuously, while the presidents of the other regional Federal Reserve Banks rotate their service in one-year terms.
Alpha: Measures the difference between a portfolio’s actual returns and its expected performance, given its level of risk as measured by Beta. A positive (negative) Alpha indicates the portfolio has performed better (worse) than its Beta would predict.
INDEX DEFINITIONS
The Alerian MLP Index is a composite of the 50 most prominent energy master limited partnerships that provides investors with an unbiased, comprehensive benchmark for this emerging asset class. The index, which is calculated using a float-adjusted, capitalization-weighted methodology, is disseminated in real time on a price-return basis (NYSE: AMZ) and on a total-return basis (NYSE: AMZX).
The Barclays U.S. Aggregate Bond Index is a broad-based flagship benchmark that measures the investment-grade, U.S. dollar-denominated, fixed-rate taxable bond market. The index includes Treasuries, government-related and corporate securities, MBS (agency fixed-rate and hybrid ARM pass-throughs), ABS, and CMBS (agency and non-agency).
The Barclays U.S. Aggregate Securitized MBS Index tracks agency mortgage backed pass-through securities (both fixed-rate and hybrid (ARM) guaranteed by Ginnie Mae (GNMA), Fannie Mae (FNMA), and Freddie Mac (FHLMC).
The Barclays Capital High Yield Index covers the universe of publicly issued debt obligations rated below investment grade. Bonds must be rated below investment grade or high yield (Ba1/BB+ or lower), by at least two of the following ratings agencies: Moody’s, S&P, and Fitch. Bonds must also have at least one year to maturity, have at least $150 million in par value outstanding, and must be U.S. dollar denominated and nonconvertible. Bonds issued by countries designated as emerging markets are excluded.
The Barclays 7-year Municipal Bond Index is the 7 Year (6 -8 year) component of the Barclays Municipal Bond, which is a rules-based, market-value-weighted index engineered for the long-term tax-exempt bond market.
The Barclays Corporate Investment Grade Credit Index is a broad-based benchmark that measures the investment-grade, U.S. dollar-denominated, fixedrate, taxable corporate bond market. It includes USD-denominated securities publicly issued by U.S. and non-U.S. industrial, utility, and financial issuers that meet specified maturity, liquidity, and quality requirements.
The Barclays U.S. High-Yield Loan Index tracks the market for dollar-denominated floating-rate leveraged loans. Instead of individual securities, the U.S. HighYield Loan Index is composed of loan tranches that may contain multiple contracts at the borrower level.
The Barclays Municipal High Yield Bond Index is comprised of bonds with maturities greater than one year, having a par value of at least $3 million issued as part of a transaction size greater than $20 million, and rated no higher than ‘BB+’ or equivalent by any of the three principal rating agencies. (The long and the short are subindexes of the Municipal Bond Index, based on duration length.)
The Barclays U.S. TIPS Index is a rules-based, market value-weighted index that tracks Inflation-Protected Securities issued by the U.S. Treasury. The U.S. TIPS Index is a subset of the Global Inflation-Linked Index, with a 36% market value weight in the index (as of December 2007), but is not eligible for other nominal treasury or aggregate indexes In order to prevent the erosion of purchasing power, TIPS are indexed to the nonseasonally adjusted Consumer Price Index for All Urban Consumers, or the CPI-U (CPI).
The Barclays U.S. Treasury Index is an unmanaged index of public debt obligations of the U.S. Treasury with a remaining maturity of one year or more. The index does not include T-bills (due to the maturity constraint), zero coupon bonds (strips), or Treasury Inflation-Protected Securities (TIPS). (The long and the intermediate are subindexes of the U.S. Treasury Index, based on duration length.)
The Bloomberg Commodity Index is calculated on an excess return basis and composed of futures contracts on 22 physical commodities. It reflects the return of underlying commodity futures price movements.
The BofA Merrill Lynch BB-B U.S. High Yield Constrained Index contains all securities in the BofA Merrill Lynch US High Yield Index rated BB+ through B- by S&P (or equivalent as rated by Moody’s or Fitch), but caps issuer exposure at 2%. Index constituents are capitalization-weighted, based on their current amount outstanding, provided the total allocation to an individual issuer does not exceed 2%.
The BofA Merrill Lynch U.S. Convertibles Ex-Mandatory Index is a rule-driven Index designed to capture the organic evolution of the U.S. convertible market and adjust automatically based on any changes in the market such as size of the market, industry skew, structure popularity, issuer size or equity sensitivity. The index rules include issues: U.S. dollar denominated greater than $50M in aggregate market value that are publicly traded (including 144A) in the U.S. market but are not currently in bankruptcy. Exclusions are synthetic convertibles and mandatory convertibles.
The Dow Jones Industrial Average Index is comprised of U.S.-listed stocks of companies that produce other (non-transportation and non-utility) goods and services. The Dow Jones industrial averages are maintained by editors of The Wall Street Journal. While the stock selection process is somewhat subjective, a stock typically is added only if the company has an excellent reputation, demonstrates sustained growth, is of interest to a large number of investors, and accurately represents the market sectors covered by the average. The Dow Jones averages are unique in that they are price weighted; therefore, their component weightings are affected only by changes in the stocks’ prices.
The Dow Jones U.S. Select REIT Index (formerly the DJ Wilshire REIT) intends to measure the performance of publicly traded REITs and REIT-like securities. The index is a subset of the Dow Jones U.S. Select Real Estate Securities Index (RESI), which represents equity REITs and real estate operating companies (REOCs) traded in the U.S. The indices are designed to serve as proxies for direct real estate investment, in part by excluding companies whose performance may be driven by factors other than the value of real estate.
The HFRX Absolute Return Index is designed to be representative of the overall composition of the hedge fund universe. It is comprised of all eligible hedge fund strategies; including but not limited to convertible arbitrage, distressed securities, equity hedge, equity market neutral, event driven, macro, merger arbitrage, and
relative value arbitrage.
The HFRX Distressed Restructuring Index strategies employ an investment process focused on corporate fixed income instruments, primarily on corporate credit instruments of companies trading at significant discounts to their value at issuance or obliged (par value) at maturity as a result of either formal bankruptcy proceeding or financial market perception of near term proceedings. Managers are typically actively involved with the management of these companies, frequently involved on creditors’ committees in negotiating the exchange of securities for alternative obligations, either swaps of debt, equity, or hybrid securities. Managers employ fundamental credit processes focused on valuation and asset coverage of securities of distressed firms; in most cases portfolio exposures are concentrated in instruments that are publicly traded, in some cases actively and in others under reduced liquidity, but in general for which a reasonable public market exists. In contrast to special situations, distressed strategies employ primarily debt (greater than 60%) but also may maintain related equity exposure.
The HFRX Equity Hedge Index, also known as long/short equity, combines core long holdings of equities with short sales of stock or stock index options. Equity hedge portfolios may be anywhere from net long to net short, depending on market conditions. Equity hedge managers generally increase net long exposure in bull markets and decrease net long exposure (or even are net short) in a bear market. Generally, the short exposure is intended to generate an ongoing positive return in addition to acting as a hedge against a general stock market decline. Stock index put options are also often used as a hedge against market risk. Profits are made when long positions appreciate and stocks sold short depreciate. Conversely, losses are incurred when long positions depreciate or the value of stocks sold short appreciates. Equity hedge managers’ source of return is similar to that of traditional stock pickers on the upside, but they use short selling and hedging to attempt to outperform the market on the downside.
The HFRX Equity Market Neutral Index strategies employ sophisticated quantitative techniques of analyzing price data to ascertain information about future price movement and relationships between securities, select securities for purchase and sale. These can include both factor-based and statistical arbitrage/trading strategies. Factor-based investment strategies include strategies in which the investment thesis is predicated on the systematic analysis of common relationships between securities. In many but not all cases, portfolios are constructed to be neutral to one or multiple variables, such as broader equity markets in dollar or beta terms, and leverage is frequently employed to enhance the return profile of the positions identified. Statistical arbitrage/trading strategies consist of strategies in which the investment thesis is predicated on exploiting pricing anomalies that may occur as a function of expected mean reversion inherent in security prices; high frequency techniques may be employed and trading strategies may also be employed on the basis on technical analysis or opportunistically to exploit new information the investment manager believes has not been fully, completely, or accurately discounted into current security prices. Equity market neutral strategies typically maintain characteristic net equity market exposure no greater than 10% long or short.
The HFRX Event Driven Index managers maintain positions in companies currently or prospectively involved in corporate transactions of a wide variety, including but not limited to mergers, restructurings, financial distress, tender offers, shareholder buybacks, debt exchanges, security issuance, or other capital structure adjustments. Security types can range from most senior in the capital structure to most junior or subordinated, and frequently involve additional derivative securities. Event driven exposure includes a combination of sensitivities to equity markets, credit markets and idiosyncratic, company-specific developments. Investment theses are typically predicated on fundamental characteristics (as opposed to quantitative), with the realization of the thesis predicated on a specific development exogenous to the existing capital structure.
The HFRX Global Hedge Fund Index is designed to be representative of the overall composition of the hedge fund universe. It is comprised of all eligible hedge fund strategies, including but not limited to convertible arbitrage, distressed securities, equity hedge, equity market neutral, event driven, macro, merger arbitrage, and relative value arbitrage. The strategies are asset weighted based on the distribution of assets in the hedge fund industry.
The HFRX Macro Index strategy managers trade a broad range of strategies in which the investment process is predicated on movements in underlying economic variables and the impact these have on equity, fixed income, hard currency, and commodity markets. Managers employ a variety of techniques, both discretionary and systematic analysis, combinations of top-down and bottom-up theses, quantitative and fundamental approaches, and long- and short-term holding periods. Although some strategies employ RV techniques, macro strategies are distinct from RV strategies in that the primary investment thesis is predicated on predicted or future movements in the underlying instruments, rather than realization of a valuation discrepancy between securities. In a similar way, while both macro and equity hedge managers may hold equity securities, the overriding investment thesis is predicated on the impact movements in underlying macroeconomic variables may have on security prices, as opposed to EH, in which the fundamental characteristics on the company are the most significant and integral to investment thesis.
The HFRX Macro: Systematic Diversified CTA Index strategies have investment processes typically as function of mathematical, algorithmic, and technical models, with little or no influence of individuals over the portfolio positioning. Strategies employ an investment process designed to identify opportunities in markets exhibiting trending or momentum characteristics across individual instruments or asset classes. Strategies typically employ a quantitative process that focuses on statistically robust or technical patterns in the return series of the asset, and they typically focus on highly liquid instruments and maintain shorter holding periods than either discretionary or mean reverting strategies. Although some strategies seek to employ counter trend models, strategies benefit most from an environment characterized by persistent, discernible trending behavior. Systematic diversified strategies typically would expect to have no greater than 35% of the portfolio in either dedicated currency or commodity exposures over a given market cycle.
The HFRX Market Directional Index is comprised of all eligible hedge fund strategies, including but not limited to convertible arbitrage, distressed securities, equity hedge, equity market neutral, event driven, macro, merger arbitrage, and relative value arbitrage. As a component of the optimization process, the index selects constituents which characteristically exhibit higher volatilities and higher correlations to standard directional benchmarks of equity, bond market, and hedge fund industry.
The HFRX Merger Arbitrage Index strategies employ an investment process primarily focused on opportunities in equity and equity-related instruments of companies that are currently engaged in a corporate transaction. Merger arbitrage involves primarily announced transactions, typically with limited or no exposure to situations that pre- or post-date, or situations in which no formal announcement is expected to occur. Opportunities are frequently presented in cross border, collared, and international transactions that incorporate multiple geographic regulatory institutions, with typically involve minimal exposure to corporate credits. Merger arbitrage strategies typically have over 75% of positions in announced transactions over a given market cycle.
The HFRX Relative Value Arbitrage Index includes managers who maintain positions in which the investment thesis is predicated on the realization of a valuation discrepancy in the relationship between multiple securities. Managers employ a variety of fundamental and quantitative techniques to establish investment theses, and security types range broadly across equity, fixed income, derivative, or other security types. Fixed income strategies are typically quantitatively driven to measure the existing relationship between instruments and, in some cases, identify attractive positions in which the risk adjusted spread between these instruments represents an attractive opportunity for the investment manager. RV position may be involved in corporate transactions also, but as opposed to ED exposures, the investment thesis is predicated on the realization of a pricing discrepancy between related securities, as opposed to the outcome of the corporate transaction.
The HFRX RV: FI-Convertible Arbitrage Index includes strategies in which the investment thesis is predicated on realization of a spread between related instruments in which one or multiple components of the spread is a convertible fixed income instrument. Strategies employ an investment process designed to isolate attractive opportunities between the price of a convertible security and the price of a non-convertible security, typically of the same issuer. Convertible arbitrage positions maintain characteristic sensitivities to credit quality the issuer, implied and realized volatility of the underlying instruments, levels of interest rates and the valuation of the issuer’s equity, among other more general market and idiosyncratic sensitivities.
The J.P. Morgan GBI Global ex-U.S. Hedged Index tracks fixed rate issuances from high-income countries spanning the globe, launched in 1989.
The JPM GBI Global ex-U.S. Unhedged Index generally tracks fixed rate issuances form high-income countries spanning North America, Europe, and Asia, not including the United States.
The JPM GBI-EM Global Diversified Index limits the weights of those index countries with larger debt stocks by only including a specified portion of these countries as eligible, current face amounts of debt outstanding.
The JPM ELMI+ and JPM ELMI+ Composite Indexes measure the performance of debt issued by emerging markets in the local currency.
The Merrill Lynch Preferred Stock Hybrid Securities Index is an unmanaged index consisting of a set of investment-grade, exchange-traded preferred stocks with outstanding market values of at least $50 million that are covered by Merrill Lynch Fixed Income Research.
The MSCI AC Asia Pacific ex-Japan Index captures large and mid cap representation across four of five developed markets countries (excluding Japan) and eight emerging markets countries in the Asia Pacific region. With 682 constituents, the index covers approximately 85% of the free float-adjusted market capitalization in each country.
The MSCI ACWI ex-U.S. Index captures large and mid cap representation across 22 of 23 developed markets (DM) countries (excluding the U.S.) and 23 emerging markets (EM) countries. With 1,839 constituents, the index covers approximately 85% of the global equity opportunity set outside the U.S.
The MSCI ACWI ex-U.S. SMID Cap Index captures mid and small cap representation across 22 of 23 developed market (DM) countries (excluding the U.S.) and 23 emerging markets countries. With 5,164 constituents, the index covers approximately 28% of the free float-adjusted market capitalization in each country.
The MSCI EAFE Index is recognized as the pre-eminent benchmark in the United States to measure international equity performance. It comprises the MSCI country indexes that represent developed markets outside of North America: Europe, Australasia, and the Far East.
The MSCI EAFE SMID Cap Index captures mid and small cap representation across developed market countries around the world, excluding the U.S. and Canada. With 2,695 constituents, the index covers approximately 28% of the free float-adjusted market capitalization in each country.
The MSCI Emerging Markets Index captures large and mid cap representation across 23 emerging markets (EM) countries. With 822 constituents, the index covers approximately 85% of the free float-adjusted market capitalization in each country.
The MSCI Emerging Markets EMEA Index captures large and mid cap representation across eight emerging markets (EM) countries in Europe, the Middle East and Africa (EMEA). With 162 constituents, the index covers approximately 85% of the free float-adjusted market capitalization in each country.
The MSCI Emerging Markets (EM) Latin America Index captures large and mid cap representation across five emerging markets (EM) countries in Latin America. With 137 constituents, the index covers approximately 85% of the free float-adjusted market capitalization in each country.
The MSCI Europe Index is a free float-adjusted, market capitalization-weighted index that is designed to measure the equity market performance of the developed markets in Europe.
The MSCI Frontier Markets Index captures large and mid cap representation across 24 frontier markets (FM) countries. The index includes 127 constituents, covering about 85% of the free float-adjusted market capitalization in each country.
The MSCI Japan Index is a free float-adjusted, market capitalization-weighted index that is designed to track the equity market performance of Japanese securities listed on Tokyo Stock Exchange, Osaka Stock Exchange, JASDAQ, and Nagoya Stock Exchange.
The MSCI U.S. REIT Index is a free float-adjusted market capitalization index that is comprised of equity REITs. The index is based on MSCI USA Investable Market Index (IMI), its parent index that captures large, mid, and small caps securities. With 139 constituents, it represents about 99% of the U.S. REIT universe and securities are classified in the REIT sector according to the Global Industry Classification Standard (GICS). It, however, excludes mortgage REITs and selected specialized REITs.
The Russell 1000 Index measures the performance of the large cap segment of the U.S. equity universe. It is a subset of the Russell 3000 Index and includes approximately 1000 of the largest securities based on a combination of their market cap and current index membership. The Russell 1000 represents approximately 92% of the U.S. market.
The Russell 1000 Value Index measures the performance of the large cap value segment of the U.S. equity universe.
The Russell 1000 Growth Index measures the performance of the large cap growth segment of the U.S. equity universe.
The Russell 2000 Index measures the performance of the small cap segment of the U.S. equity universe. The Russell 2000 Index is a subset of the Russell 3000 Index representing approximately 10% of the total market capitalization of that index.
The Russell 2000 Growth Index measures the performance of those Russell 2000 companies with higher price-to-book ratios and higher forecasted growth values.
The Russell 2000 Value Index measures the performance of those Russell 2000 companies with lower price-to-book ratios and lower forecasted growth values.
The Russell 2500 Index is a broad index featuring 2,500 stocks that cover the small and mid cap market capitalizations. The Russell 2500 is a market capitalization-weighted index that includes the smallest 2,500 companies covered in the Russell 3000 universe of U.S.-based listed equities.
The Russell 3000 Index measures the performance of the largest 3,000 U.S. companies representing approximately 98% of the investable U.S. equity market.
The Russell 3000 Growth Index measures the performance of the broad growth segment of the U.S. equity universe. It includes those Russell 3000 companies with higher price-to-book ratios and higher forecasted growth values.
The Russell 3000 Value Index measures the performance of the broad value segment of U.S. equity value universe. It includes those Russell 3000 companies with lower price-to-book ratios and lower forecasted growth values.
The Russell Microcap Index measures the performance of the microcap segment of the U.S. equity market. Microcap stocks make up less than 3% of the U.S. equity market (by market cap) and consist of the smallest 1,000 securities in the small-cap Russell 2000 Index, plus the next 1,000 smallest eligible securities by market cap.
The Russell Midcap Index offers investors access to the mid cap segment of the U.S. equity universe. The Russell Midcap Index is constructed to provide a comprehensive and unbiased barometer for the mid cap segment and is completely reconstituted annually to ensure that larger stocks do not distort the performance and characteristics of the true mid cap opportunity set. The Russell Midcap Index includes the smallest 800 securities in the Russell 1000.
The Russell Midcap Growth Index offers investors access to the mid cap growth segment of the U.S. equity universe.
The Russell Midcap Growth Index is constructed to provide a comprehensive and unbiased barometer of the mid cap growth market. Based on ongoing empirical research of investment manager behavior, the methodology used to determine growth probability approximates the aggregate mid cap growth manager’s opportunity set.
The Russell Midcap Value Index offers investors access to the mid cap value segment of the U.S. equity universe. The Russell Midcap Value Index is constructed to provide a comprehensive and unbiased barometer of the mid cap value market. Based on ongoing empirical research of investment manager behavior, the methodology used to determine value probability approximates the aggregate mid cap value manager’s opportunity set.
The S&P 500 Index is a capitalization-weighted index of 500 stocks designed to measure performance of the broad domestic economy through changes in the aggregate market value of 500 stocks representing all major industries.
The S&P Global Infrastructure Index is comprised of 75 of the largest publicly listed infrastructure companies that meet specific investability requirements. The index is designed to provide liquid exposure to the leading publicly listed companies in the global infrastructure industry, from both developed markets and emerging markets.
The S&P Utilities Index is comprised primarily of companies involved in water and electrical power and natural gas distribution industries.
The S&P Developed Ex-U.S. Property defines and measures the investable universe of publicly traded property companies domiciled in developed countries outside of the U.S. The companies included are engaged in real estate related activities, such as property ownership, management, development, rental and investment.
The USD Index measures the performance of the U.S. dollar against a basket of foreign currencies: EUR, JPY, GBP, CAD, CHF and SEK. The U.S. Dollar Index goes up when the dollar gains “strength” compared to other currencies.
This research material has been prepared by LPL Financial LLC.
To the extent you are receiving investment advice from a separately registered independent investment advisor, please note that LPL Financial LLC is not an affiliate of and makes no representation with respect to such entity.
Not FDIC or NCUA/NCUSIF Insured | No Bank or Credit Union Guarantee | May Lose Value | Not Guaranteed by Any Government Agency | Not a Bank/Credit Union Deposit
Tracking #1-485086 (Exp. 04/17)