
JANUARY 2016 IN REVIEW
Click here to download a PDF of this report.
ECONOMY: U.S. GROWTH SLOWS AS ECONOMIC SECTORS FOLLOW DIVERGING PATHS
Economic Data
U.S. economic data released in January, which largely capture economic activity in December, continued to suggest a below-trend pace of growth in the U.S. Despite lackluster gross domestic product (GDP) growth in the fourth quarter of 2015, there is little evidence that the U.S. is in a recession and, based on historical data, the Conference Board’s Leading Economic Index (LEI) puts the probability of a recession in the next year at 10–15%. The overall story for the U.S. economy continues to be about diverging paths between consumer activity and services sector expansion, on the one hand, and a truggling manufacturing and export sector, on the other. Because services make up 80–90% of U.S. business activity and consumer spending accounts for about two-thirds of U.S. GDP, strength in these areas continues to carry overall U.S. economic growth forward, despite headwinds from weakening capital expenditures due to low oil prices and falling international demand for U.S. goods due largely to a strong dollar.
The initial estimate of fourth quarter 2015 GDP growth showed the economy had expanded at a disappointing 0.7% annualized pace during the quarter, slightly missing expectations. Weakness was most pronounced in the business sector, with business investment spending contributing negatively to GDP growth for the first time since the third quarter of 2012. Spending on inventories, which tends to be cyclical, also made a negative contribution, while the contribution from net exports further deteriorated. Although consumer spending’s contribution to GDP growth slowed, real consumer spending grew at a frustrating but still healthy annualized rate of 2.2%, while the contribution from home construction remained steady.

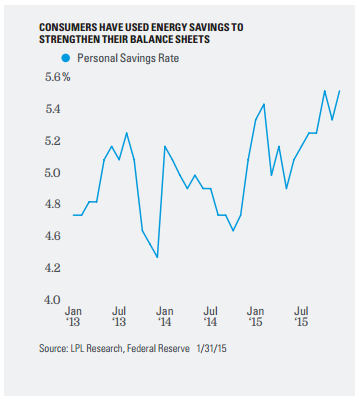
January releases provided continued confirmation of a favorable consumer environment. Non-farm payroll growth for December handily topped consensus expectations of 200,000, coming in at 292,000, with a sizable upward revision to November’s data. Housing-related data also looked strong, with new home sales, used home sales, and permits all topping expectations, although housing starts missed. And despite January’s market volatility, consumer sentiment in January rose, also topping expectations. Consumer spending, however, disappointed; retail sales ex-auto and gas came in flat as consumers continued to be more inclined to save rather than spend the windfall from low energy prices.
Looking at the business environment, services sector activity measures from the Institute for Supply Management (ISM) and Markit continued to show expansion in December. In addition, the National Federation of Independent Business (NFIB) survey of small businesses, which tend to be less exposed to international markets, showed small business optimism strengthened in December. But the manufacturing sector continued to struggle. The ISM Manufacturing Purchasing Managers’ Index (PMI) for December declined and remained at a level indicating contraction. Preliminary December data for shipments of non-defense capital goods exaircraft, which feed directly through to GDP as capital expenditures, contracted 0.2%; while orders, a more forward-looking data point, fell sharply.
Central Banks
The gap between U.S. monetary policy and that of most other major central banks widened in January. The Federal Reserve (Fed) maintained its policy path while the Bank of Japan surprised markets by lowering its benchmark rate to below zero. The European Central Bank (ECB) took no action in January, but ECB President Mario Draghi gestured toward the possibility of further easing in March. Outside of the U.S., the only G20 major economies currently hiking rates are emerging market economies: South Africa and Brazil (to counter inflation), and Mexico (to counter currency devaluation).
The Fed’s policy arm, the Federal Open Market Committee (FOMC), made no policy change at its January meeting following its decision to raise the target fed funds rate for the first time in nine years at its December 2015 meeting. The most noteworthy change in the FOMC policy statement was the removal of the line, “The Committee sees the risks to the outlook for both economic activity and the labor market as balanced,” signaling increased uncertainty. The Fed modestly upgraded its assessment of the labor market, took a mixed view of inflation expectations (consumer inflation expectations holding their ground, market-based expectations declining), and continued to say that future rate hikes will be data dependent and that it is not ready to let its balance sheet shrink anytime soon.
GLOBAL EQUITIES: GLOBAL EQUITIES FALL IN JANUARY AS UNCERTAINTY DRIVES SENTIMENT LOWER
U.S.
Domestic equity markets struggled to find their footing in January, posting a second consecutive monthly decline. The S&P 500 finished the month with a total return of -5.0%, after rallying into the end of the month from a peak decline of -9% on a closing basis. Contributing to the month-end rally was a surprise move by the Bank of Japan to introduce a negative interest rate regime to further its fight against deflationary forces. January included three weeks of earnings reports, with nearly 40% of the S&P 500 reporting. In total, reported earnings growth was -3.2%, as the energy and materials sectors continued to struggle with supply imbalances and slowing global growth. Beyond these problem sectors, the results were mixed, as the industrials and technology sectors saw negative earnings growth, while telecommunications, consumer discretionary, utilities, healthcare, financials, and consumer staples were all able to grow earnings on a year-over-year basis. Beyond the actual results, forward guidance has also been an incremental drag as management teams look to manage expectations for full-year 2016 guidance.
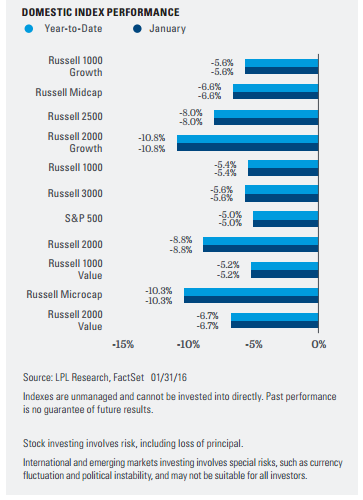
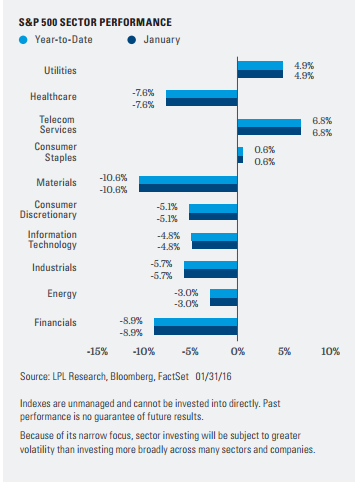
Sector performance largely reflected poor investor sentiment as value outperformed growth, and large caps continued their outperformance relative to small caps. Sectors traditionally perceived as defensive also outperformed their cyclical counterparts on balance as the telecommunications, utilities, and consumer staples posted strong relative and positive absolute performance during the month. The remaining seven GICS sectors were down in absolute terms, with only energy and technology managing to beat the market. Materials was the worst performing sector due to global growth sensitivity. The energy sector managed to decouple a bit from the broader equity market during the month, outperforming by nearly 200 basis points (2%). This outperformance was driven primarily by a large 27% rally in the price of oil in the last two weeks of the month from its low of $26.55.
International
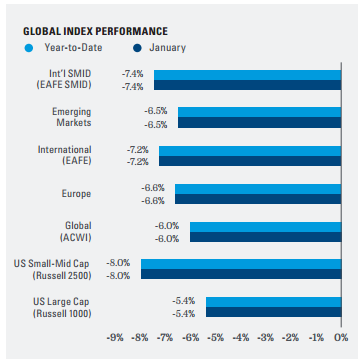
International stocks, as represented by the MSCI EAFE Index (foreign developed) and MSCI Emerging Markets Index, both posted losses in January and continued their underperformance relative to the S&P 500 on a trailing one-year and three-year basis. European stocks opened the month with poor performance, but outperformed domestic equities into the end of the month as ECB President Mario Draghi surprised investors with a pledge to “review and possibly reconsider” stimulus at the central bank’s March meeting. Japanese equities were down on the month but did end the final trading day of the month on a strong note as authorities surprised the market with a move to a negative interest rate policy. Emerging market declines were broad based, with weak commodity prices continuing to provide a significant headwind. However, performance off the lows in the final days of the month did outpace domestic equities, as the market discounted the likelihood of further rate hikes by the Fed and oil prices posed a significant rally.
FIXED INCOME: YIELDS DECLINE ON FALLING GROWTH AND INFLATION EXPECTATIONS
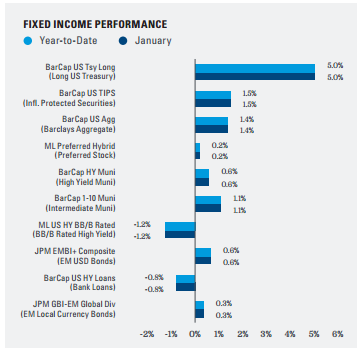
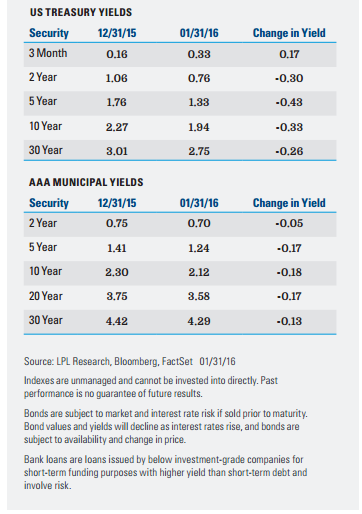
Bond yields fell across the majority of the maturity spectrum during January, in response to weaker global growth expectations and low inflation expectations. The move lower in yields reversed all of the increase that occurred in Q4 2015 ahead of the FOMC meeting in December, during which the Fed raised interest rates.
The flattening yield curve and overall decline in interest rates was a greater tailwind for long-term bonds relative to short-term bonds. Among sectors, highquality bonds benefited most and the Barclays U.S. Aggregate Index returned 1.4% during the month. Economically sensitive sectors continued to be hurt by an aversion to lower-quality bonds and concerns about defaults in the energy sector amid progressively lower oil prices (oil fell another 9% during January). Highyield returned -1.2% during January and bank loans returned -0.8%. Continued central bank intervention abroad helped European government rates decline further, pushing foreign hedged bonds to a strong 2.0% return for the month.
Municipal bonds underperformed Treasuries during January, as is typical in falling interest rate environments, but recorded a very strong month nonetheless. The Barclays 7 Year (6-8) Municipal Index returned 1.4% during the month, driven by general high-quality bond strength, but also by good seasonality in January, as many municipal investors have cash to put to work as a result of coupon payments and maturing issues.
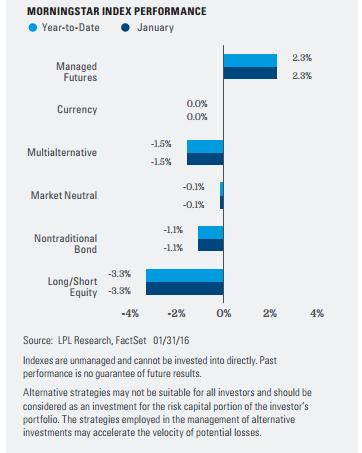
ALTERNATIVES: MANAGED FUTURES DELIVER
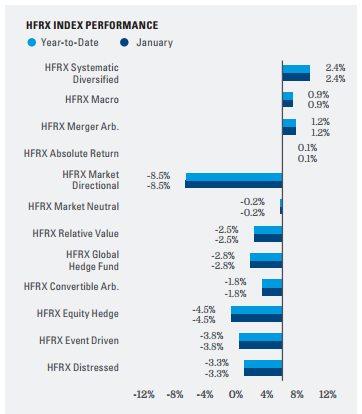
There was a significant range in January performance across the alternative investment universe, as the S&P 500 (down 5.0%) encountered the largest decline to start a year since 2009. Macro related strategies led gains, with the HFRX Macro/CTA Index gaining 0.9%, while the HFRX Systematic Diversified Index gained 2.4%. On the downside, long/short managers, as represented by the HFRX Equity Hedge Index, were down 4.5%. A preference for more cyclical sectors such as consumer discretionary and technology acted as a headwind, as only more defensive sectors were able to weather the sell-off. Long/short strategies held up well during the first half of the month, providing strong downside protection. However, during the rally in the last week of trading, many managers were too conservatively positioned to keep pace with the broader equity market gains.
Systematic macro managers gained from long credit exposure, specifically in Treasuries and German bunds, while short equity contracts across the globe also provided positive returns. Further, the continued downtrend in oil prices was another positive contribution. Overall, performance for managed futures in January was a perfect example of the diversification benefit they may provide during bouts of market turmoil. Equity market neutral managers also continued to perform well, with a decline of only 0.2% and a gain of 4.8% over the past year, which leads gains in all alternative and traditional benchmarks. Managers in the distressed space continue to underperform (HFRX Event Driven Distressed Securities down 3.3%). Several strategists have acknowledged entering energy-related trades too early in the cycle, while others continue to build cash levels, with the expectation to deploy after stabilization in energy prices.
SAFE-HAVEN REAL ASSETS OUTPERFORM IN JANUARY
As global markets were roiled by volatility, the month of January provided mixed returns for real assets, with those exhibiting safe-haven characteristics posting strong performance. The Bloomberg Commodity Index fell 1.7% in January, while the U.S. dollar ended marginally up, and the 10-year Treasury yield fell greater than 40 basis points (0.4%) in a flight to quality rally. The S&P 500 ended a volatile month down 5.0%. Gold and silver benefited in their capacities as safe havens, returning 5.3% and 3.2% respectively.
MLPs & Global Listed Infrastructure
Master limited partnerships (MLP) traded down sympathetically with oil, as has been the case in many instances since late 2014. The Alerian MLP Index fell 11.1% in January, in what ended as the worst month for the asset class since the financial crisis. On a positive note, the final two weeks of the month did see positive returns. The primary driver of returns in January was oil, as fundamental news in the sector could be construed as positive. As earnings season has progressed, many companies are appeasing investors by lowering their capital expenditure budgets and “high grading” project backlogs. This should afford management teams the luxury of not being required to tap the capital markets to fund growth in an inhospitable capital raising environment. With respect to fourth quarter distribution announcements (which are almost complete), 30 companies have increased distributions quarter over quarter, 50 have held distributions flat, and 8 have cut distributions.
Global listed infrastructure, as measured by the S&P Global Infrastructure Index, returned -0.8% for the month. The index was dragged down by outsized negative returns from the Asian component (S&P Asia Infrastructure Index down 6.1%).
REITs
Even as interest rates fell in January, real estate investment trusts (REIT) ended solidly in negative territory. The MSCI U.S. REIT Index finished the month down 3.5%. Outperforming sub-sectors were specialized and retail REITs, while office, industrial, and diversified REITs were laggards.
Commodities
Commodities continued their negative momentum from 2015 and ended the month down 1.7% as measured by the Bloomberg Commodity Index. As has seemed to be the case in most recent months, oil was the primary culprit for the index’s decline. WTI crude oil ended the month down 9.2% while Brent crude returned -3.5%. Weakness in China and the subsequent fears of global growth declining undoubtedly contributed to the collapse in prices. The market is still waiting for material production decreases, as U.S. production has only declined to 9.3 million barrels per day from a peak in April 2015 of 9.7 million barrels per day. Rumors of Saudi Arabia and Russia working together to strike a deal on cutting production helped raise prices near the end of the month but never materialized.
IMPORTANT DISCLOSURES
The economic forecasts set forth in the presentation may not develop as predicted. The opinions voiced in this material are for general information only and are not intended to provide or be construed as providing specific investment advice or recommendations for any individual security. There is no assurance that the techniques and strategies discussed are suitable for all investors or will yield positive outcomes. The purchase of certain securities may be required to affect some of the strategies.
Stock and Pooled Investment Risks
There is no guarantee that a diversified portfolio will enhance overall returns or outperform a non-diversified portfolio. Diversification does not ensure against market risk.
Investments in specialized industry sectors have additional risks, which are outlined in the prospectus. Please read the fund’s prospectus for more information onrisks, fees, and other important information.
Bond and Debt Equity Risks
Government bonds and Treasury bills are guaranteed by the U.S. government as to the timely payment of principal and interest and, if held to maturity, offer a fixed rate of return and fixed principal value. However, the value of fund shares is not guaranteed and will fluctuate.
High-yield/junk bonds are not investment-grade securities, involve substantial risks, and generally should be part of the diversified portfolio of sophisticated investors.
Investing in foreign and emerging markets debt securities involves special additional risks. These risks include, but are not limited to, currency risk, geopolitical and regulatory risk, and risk associated with varying settlement standards.
Municipal bonds are subject to availability, price, and to market and interest rate risk if sold prior to maturity. Bond values will decline as interest rate rise. Interest income may be subject to the alternative minimum tax. Federally tax-free but other state and local taxes may apply.
Treasury Inflation-Protected Securities (TIPS) help eliminate inflation risk to your portfolio, as the principal is adjusted semiannually for inflation based on the Consumer Price Index (CPI)—while providing a real rate of return guaranteed by the U.S. government. However, a few things you need to be aware of is that the CPI might not accurately match the general inflation rate; so the principal balance on TIPS may not keep pace with the actual rate of inflation. The real interest yields on TIPS may rise, especially if there is a sharp spike in interest rates. If so, the rate of return on TIPS could lag behind other types of inflation-protected securities, like floating rate notes and T-bills. TIPS do not pay the inflation-adjusted balance until maturity, and the accrued principal on TIPS could decline, if there is deflation.
Alternative Risks
Currency risk is a form of risk that arises from the change in price of one currency against another. Whenever investors or companies have assets or business operations across national borders, they face currency risk if their positions are not hedged.
Investing in real estate/REITs involves special risks such as potential illiquidity and may not be suitable for all investors. There is no assurance that the investment objectives of this program will be attained.
Investing in MLPs involves additional risks as compared with the risks of investing in common stock, including risks related to cash flow, dilution, and voting rights.
MLPs may trade less frequently than larger companies due to their smaller capitalizations, which may result in erratic price movement or difficulty in buying or selling. MLPs are subject to significant regulation and may be adversely affected by changes in the regulatory environment, including the risk that an MLP could lose its tax status as a partnership. Additional management fees and other expenses are associated with investing in MLP funds.
Currency risk is a form of risk that arises from the change in price of one currency against another. Whenever investors or companies have assets or business operations across national borders, they face currency risk if their positions are not hedged.
Long/short equity funds are subject to normal alternative investment risks, including potentially higher fees; while there is additional management risk, as the manager is attempting to accurately anticipate the likely movement of both their long and short holdings. There is also the risk of “beta-mismatch,” in which long positions could lose more than short positions during falling markets.
Global macro strategies attempt to profit from anticipated price movements in stock markets, interest rates, foreign exchange and physical commodities. Global macro risks include but are not limited to imperfect knowledge of macro events, divergent movement from macro events, loss of principal, and related geopolitical risks.
Event driven strategies, such as merger arbitrage, consist of buying shares of the target company in a proposed merger and fully or partially hedging the exposure to the acquirer by shorting the stock of the acquiring company or other means. This strategy involves significant risk as events may not occur as planned and disruptions to a planned merger may result in significant loss to a hedged position.
The small business optimism index is compiled from a survey that is conducted each month by the National Federation of Independent Business (NFIB) of its members. The index is a composite of ten seasonally adjusted components based on questions on the following: plans to increase employment, plans to make capital outlays, plans to increase inventories, expect economy to improve, expect real sales higher, current inventory, current job openings, expected credit conditions, now a good time to expand, and earnings trend.
Monetary policy is the process through which the monetary authority (central bank, currency board, or other regulatory committee) of a country controls the size and rate of growth of the money supply, which in turn affects interest rates.
Global Industry Classification Standard (GICS): A standardized classification system for equities developed jointly by Morgan Stanley Capital International (MSCI) and Standard & Poor’s. The GICS methodology is used by the MSCI indexes, which include domestic and international stocks, as well as by a large portion of the professional investment management community. The GICS hierarchy begins with 10 sectors and is followed by 24 industry groups, 67 industries and 147 sub-industries. Each stock that is classified will have a coding at all four of these levels. The 10 GIC Sectors are as follows: Energy, Materials, Industrials, Consumer Discretionary, Consumer Staples, Health Care, Financials, Information Technology, Telecommunication Services, and Utilities.
DEFINITIONS
Different agencies employ different rating scales for credit quality. Standard & Poor’s (S&P) and Fitch both use scales from AAA (highest) through AA, A, BBB, BB, B, CCC, CC, C to D(lowest). Moody’s uses a scale from Aaa (highest) through Aa, A, Baa, Ba, B, Caa, Ca to C (lowest).
A leading economic indicator is a commonly used signal of economic change. Examples of leading indicators include production workweek, building permits, unemployment insurance claims, money supply, inventory changes, and stock prices. The Fed watches many of these indicators as it decides what to do about interest rates.
The U.S. Institute for Supply Managers (ISM) manufacturing index is an economic indicator derived from monthly surveys of private sector companies, and is intended to show the economic health of the U.S. manufacturing sector. A PMI of more than 50 indicates expansion in the manufacturing sector, a reading below 50 indicates contraction, and a reading of 50 indicates no change.
Purchasing Managers’ Indexes (PMI) are economic indicators derived from monthly surveys of private sector companies, and are intended to show the economic health of the manufacturing sector. A PMI of more than 50 indicates expansion in the manufacturing sector, a reading below 50 indicates contraction, and a reading of 50 indicates no change. The two principal producers of PMIs are Markit Group, which conducts PMIs for over 30 countries worldwide, and the Institute for Supply Management (ISM), which conducts PMIs for the US.
INDEX DEFINITIONS
The Alerian MLP Index is a composite of the 50 most prominent energy master limited partnerships that provides investors with an unbiased, comprehensive benchmark for this emerging asset class. The index, which is calculated using a float-adjusted, capitalization-weighted methodology, is disseminated in real time on a price-return basis (NYSE: AMZ) and on a total-return basis (NYSE: AMZX).
The Barclays U.S. Aggregate Bond Index is a broad-based flagship benchmark that measures the investment-grade, U.S. dollar-denominated, fixed-rate taxable bond market. The index includes Treasuries, government-related and corporate securities, MBS (agency fixed-rate and hybrid ARM pass-throughs), ABS, and CMBS (agency and non-agency).
The Barclays U.S. Aggregate Securitized MBS Index tracks agency mortgage backed pass-through securities (both fixed-rate and hybrid (ARM) guaranteed by Ginnie Mae (GNMA), Fannie Mae (FNMA), and Freddie Mac (FHLMC).
The Barclays Capital High Yield Index covers the universe of publicly issued debt obligations rated below investment grade. Bonds must be rated below investment grade or high yield (Ba1/BB+ or lower), by at least two of the following ratings agencies: Moody’s, S&P, and Fitch. Bonds must also have at least one year to maturity, have at least $150 million in par value outstanding, and must be U.S. dollar denominated and nonconvertible. Bonds issued by countries designated as emerging markets are excluded.
The Barclays 7-year Municipal Bond Index is the 7 Year (6 -8 year) component of the Barclays Municipal Bond, which is a rules-based, market-value-weighted index engineered for the long-term tax-exempt bond market.
The Barclays Corporate Investment Grade Credit Index is a broad-based benchmark that measures the investment-grade, U.S. dollar-denominated, fixedrate, taxable corporate bond market. It includes USD-denominated securities publicly issued by U.S. and non-U.S. industrial, utility, and financial issuers that meet specified maturity, liquidity, and quality requirements.
The Barclays U.S. High-Yield Loan Index tracks the market for dollar-denominated floating-rate leveraged loans. Instead of individual securities, the U.S. HighYield Loan Index is composed of loan tranches that may contain multiple contracts at the borrower level.
The Barclays Municipal High Yield Bond Index is comprised of bonds with maturities greater than one year, having a par value of at least $3 million issued as part of a transaction size greater than $20 million, and rated no higher than ‘BB+’ or equivalent by any of the three principal rating agencies. (The long and the short are subindexes of the Municipal Bond Index, based on duration length.)
The Barclays U.S. TIPS Index is a rules-based, market value-weighted index that tracks Inflation-Protected Securities issued by the U.S. Treasury. The U.S. TIPS Index is a subset of the Global Inflation-Linked Index, with a 36% market value weight in the index (as of December 2007), but is not eligible for other nominal treasury or aggregate indexes In order to prevent the erosion of purchasing power, TIPS are indexed to the nonseasonally adjusted Consumer Price Index for All Urban Consumers, or the CPI-U (CPI).
The Barclays U.S. Treasury Index is an unmanaged index of public debt obligations of the U.S. Treasury with a remaining maturity of one year or more. The index does not include T-bills (due to the maturity constraint), zero coupon bonds (strips), or Treasury Inflation-Protected Securities (TIPS). (The long and the intermediate are subindexes of the U.S. Treasury Index, based on duration length.)
The Bloomberg Commodity Index is calculated on an excess return basis and composed of futures contracts on 22 physical commodities. It reflects the return of underlying commodity futures price movements.
The BofA Merrill Lynch BB-B U.S. High Yield Constrained Index contains all securities in the BofA Merrill Lynch US High Yield Index rated BB+ through B- by S&P (or equivalent as rated by Moody’s or Fitch), but caps issuer exposure at 2%. Index constituents are capitalization-weighted, based on their current amount outstanding, provided the total allocation to an individual issuer does not exceed 2%.
The BofA Merrill Lynch U.S. Convertibles Ex-Mandatory Index is a rule-driven Index designed to capture the organic evolution of the U.S. convertible market and adjust automatically based on any changes in the market such as size of the market, industry skew, structure popularity, issuer size or equity sensitivity. The index rules include issues: U.S. dollar denominated greater than $50M in aggregate market value that are publicly traded (including 144A) in the U.S. market but are not currently in bankruptcy. Exclusions are synthetic convertibles and mandatory convertibles.
The Dow Jones Industrial Average Index is comprised of U.S.-listed stocks of companies that produce other (non-transportation and non-utility) goods and services. The Dow Jones industrial averages are maintained by editors of The Wall Street Journal. While the stock selection process is somewhat subjective, a stock typically is added only if the company has an excellent reputation, demonstrates sustained growth, is of interest to a large number of investors, and accurately represents the market sectors covered by the average. The Dow Jones averages are unique in that they are price weighted; therefore, their component weightings are affected only by changes in the stocks’ prices.
The Dow Jones U.S. Select REIT Index (formerly the DJ Wilshire REIT) intends to measure the performance of publicly traded REITs and REIT-like securities. The index is a subset of the Dow Jones U.S. Select Real Estate Securities Index (RESI), which represents equity REITs and real estate operating companies (REOCs) traded in the U.S. The indices are designed to serve as proxies for direct real estate investment, in part by excluding companies whose performance may be driven by factors other than the value of real estate.
The HFRX Absolute Return Index is designed to be representative of the overall composition of the hedge fund universe. It is comprised of all eligible hedge fund strategies; including but not limited to convertible arbitrage, distressed securities, equity hedge, equity market neutral, event driven, macro, merger arbitrage, and
relative value arbitrage.
The HFRX Distressed Restructuring Index strategies employ an investment process focused on corporate fixed income instruments, primarily on corporate credit instruments of companies trading at significant discounts to their value at issuance or obliged (par value) at maturity as a result of either formal bankruptcy proceeding or financial market perception of near term proceedings. Managers are typically actively involved with the management of these companies, frequently involved on creditors’ committees in negotiating the exchange of securities for alternative obligations, either swaps of debt, equity, or hybrid securities. Managers employ fundamental credit processes focused on valuation and asset coverage of securities of distressed firms; in most cases portfolio exposures are concentrated in instruments that are publicly traded, in some cases actively and in others under reduced liquidity, but in general for which a reasonable public market exists. In contrast to special situations, distressed strategies employ primarily debt (greater than 60%) but also may maintain related equity exposure.
The HFRX Equity Hedge Index, also known as long/short equity, combines core long holdings of equities with short sales of stock or stock index options. Equity hedge portfolios may be anywhere from net long to net short, depending on market conditions. Equity hedge managers generally increase net long exposure in bull markets and decrease net long exposure (or even are net short) in a bear market. Generally, the short exposure is intended to generate an ongoing positive return in addition to acting as a hedge against a general stock market decline. Stock index put options are also often used as a hedge against market risk. Profits are made when long positions appreciate and stocks sold short depreciate. Conversely, losses are incurred when long positions depreciate or the value of stocks sold short appreciates. Equity hedge managers’ source of return is similar to that of traditional stock pickers on the upside, but they use short selling and hedging to attempt to outperform the market on the downside.
The HFRX Equity Market Neutral Index strategies employ sophisticated quantitative techniques of analyzing price data to ascertain information about future price movement and relationships between securities, select securities for purchase and sale. These can include both factor-based and statistical arbitrage/trading strategies. Factor-based investment strategies include strategies in which the investment thesis is predicated on the systematic analysis of common relationships between securities. In many but not all cases, portfolios are constructed to be neutral to one or multiple variables, such as broader equity markets in dollar or beta terms, and leverage is frequently employed to enhance the return profile of the positions identified. Statistical arbitrage/trading strategies consist of strategies in which the investment thesis is predicated on exploiting pricing anomalies that may occur as a function of expected mean reversion inherent in security prices; high frequency techniques may be employed and trading strategies may also be employed on the basis on technical analysis or opportunistically to exploit new information the investment manager believes has not been fully, completely, or accurately discounted into current security prices. Equity market neutral strategies typically maintain characteristic net equity market exposure no greater than 10% long or short.
The HFRX Event Driven Index managers maintain positions in companies currently or prospectively involved in corporate transactions of a wide variety, including but not limited to mergers, restructurings, financial distress, tender offers, shareholder buybacks, debt exchanges, security issuance, or other capital structure adjustments. Security types can range from most senior in the capital structure to most junior or subordinated, and frequently involve additional derivative securities. Event driven exposure includes a combination of sensitivities to equity markets, credit markets and idiosyncratic, company-specific developments. Investment theses are typically predicated on fundamental characteristics (as opposed to quantitative), with the realization of the thesis predicated on a specific development exogenous to the existing capital structure.
The HFRX Global Hedge Fund Index is designed to be representative of the overall composition of the hedge fund universe. It is comprised of all eligible hedge fund strategies, including but not limited to convertible arbitrage, distressed securities, equity hedge, equity market neutral, event driven, macro, merger arbitrage, and relative value arbitrage. The strategies are asset weighted based on the distribution of assets in the hedge fund industry.
The HFRX Macro Index strategy managers trade a broad range of strategies in which the investment process is predicated on movements in underlying economic variables and the impact these have on equity, fixed income, hard currency, and commodity markets. Managers employ a variety of techniques, both discretionary and systematic analysis, combinations of top-down and bottom-up theses, quantitative and fundamental approaches, and long- and short-term holding periods. Although some strategies employ RV techniques, macro strategies are distinct from RV strategies in that the primary investment thesis is predicated on predicted or future movements in the underlying instruments, rather than realization of a valuation discrepancy between securities. In a similar way, while both macro and equity hedge managers may hold equity securities, the overriding investment thesis is predicated on the impact movements in underlying macroeconomic variables may have on security prices, as opposed to EH, in which the fundamental characteristics on the company are the most significant and integral to investment thesis.
The HFRX Macro: Systematic Diversified CTA Index strategies have investment processes typically as function of mathematical, algorithmic, and technical models, with little or no influence of individuals over the portfolio positioning. Strategies employ an investment process designed to identify opportunities in markets exhibiting trending or momentum characteristics across individual instruments or asset classes. Strategies typically employ a quantitative process that focuses on statistically robust or technical patterns in the return series of the asset, and they typically focus on highly liquid instruments and maintain shorter holding periods than either discretionary or mean reverting strategies. Although some strategies seek to employ counter trend models, strategies benefit most from an environment characterized by persistent, discernible trending behavior. Systematic diversified strategies typically would expect to have no greater than 35% of the portfolio in either dedicated currency or commodity exposures over a given market cycle.
The HFRX Market Directional Index is comprised of all eligible hedge fund strategies, including but not limited to convertible arbitrage, distressed securities, equity hedge, equity market neutral, event driven, macro, merger arbitrage, and relative value arbitrage. As a component of the optimization process, the index selects constituents which characteristically exhibit higher volatilities and higher correlations to standard directional benchmarks of equity, bond market, and hedge fund industry.
The HFRX Merger Arbitrage Index strategies employ an investment process primarily focused on opportunities in equity and equity-related instruments of companies that are currently engaged in a corporate transaction. Merger arbitrage involves primarily announced transactions, typically with limited or no exposure to situations that pre- or post-date, or situations in which no formal announcement is expected to occur. Opportunities are frequently presented in cross border, collared, and international transactions that incorporate multiple geographic regulatory institutions, with typically involve minimal exposure to corporate credits. Merger arbitrage strategies typically have over 75% of positions in announced transactions over a given market cycle.
The HFRX Relative Value Arbitrage Index includes managers who maintain positions in which the investment thesis is predicated on the realization of a valuation discrepancy in the relationship between multiple securities. Managers employ a variety of fundamental and quantitative techniques to establish investment theses, and security types range broadly across equity, fixed income, derivative, or other security types. Fixed income strategies are typically quantitatively driven to measure the existing relationship between instruments and, in some cases, identify attractive positions in which the risk adjusted spread between these instruments represents an attractive opportunity for the investment manager. RV position may be involved in corporate transactions also, but as opposed to ED exposures, the investment thesis is predicated on the realization of a pricing discrepancy between related securities, as opposed to the outcome of the corporate transaction.
The HFRX RV: FI-Convertible Arbitrage Index includes strategies in which the investment thesis is predicated on realization of a spread between related instruments in which one or multiple components of the spread is a convertible fixed income instrument. Strategies employ an investment process designed to isolate attractive opportunities between the price of a convertible security and the price of a non-convertible security, typically of the same issuer. Convertible arbitrage positions maintain characteristic sensitivities to credit quality the issuer, implied and realized volatility of the underlying instruments, levels of interest rates and the valuation of the issuer’s equity, among other more general market and idiosyncratic sensitivities.
The J.P. Morgan GBI Global ex-U.S. Hedged Index tracks fixed rate issuances from high-income countries spanning the globe, launched in 1989.
The JPM GBI Global ex-U.S. Unhedged Index generally tracks fixed rate issuances form high-income countries spanning North America, Europe, and Asia, not including the United States.
The JPM GBI-EM Global Diversified Index limits the weights of those index countries with larger debt stocks by only including a specified portion of these countries as eligible, current face amounts of debt outstanding.
The JPM ELMI+ and JPM ELMI+ Composite Indexes measure the performance of debt issued by emerging markets in the local currency.
The Merrill Lynch Preferred Stock Hybrid Securities Index is an unmanaged index consisting of a set of investment-grade, exchange-traded preferred stocks with outstanding market values of at least $50 million that are covered by Merrill Lynch Fixed Income Research.
The MSCI AC Asia Pacific ex-Japan Index captures large and mid cap representation across four of five developed markets countries (excluding Japan) and eight emerging markets countries in the Asia Pacific region. With 682 constituents, the index covers approximately 85% of the free float-adjusted market capitalization in each country.
The MSCI ACWI ex-U.S. Index captures large and mid cap representation across 22 of 23 developed markets (DM) countries (excluding the U.S.) and 23 emerging markets (EM) countries. With 1,839 constituents, the index covers approximately 85% of the global equity opportunity set outside the U.S.
The MSCI ACWI ex-U.S. SMID Cap Index captures mid and small cap representation across 22 of 23 developed market (DM) countries (excluding the U.S.) and 23 emerging markets countries. With 5,164 constituents, the index covers approximately 28% of the free float-adjusted market capitalization in each country.
The MSCI EAFE Index is recognized as the pre-eminent benchmark in the United States to measure international equity performance. It comprises the MSCI country indexes that represent developed markets outside of North America: Europe, Australasia, and the Far East.
The MSCI EAFE SMID Cap Index captures mid and small cap representation across developed market countries around the world, excluding the U.S. and Canada. With 2,695 constituents, the index covers approximately 28% of the free float-adjusted market capitalization in each country.
The MSCI Emerging Markets Index captures large and mid cap representation across 23 emerging markets (EM) countries. With 822 constituents, the index covers approximately 85% of the free float-adjusted market capitalization in each country.
The MSCI Emerging Markets EMEA Index captures large and mid cap representation across eight emerging markets (EM) countries in Europe, the Middle East and Africa (EMEA). With 162 constituents, the index covers approximately 85% of the free float-adjusted market capitalization in each country.
The MSCI Emerging Markets (EM) Latin America Index captures large and mid cap representation across five emerging markets (EM) countries in Latin America. With 137 constituents, the index covers approximately 85% of the free float-adjusted market capitalization in each country.
The MSCI Europe Index is a free float-adjusted, market capitalization-weighted index that is designed to measure the equity market performance of the developed markets in Europe.
The MSCI Frontier Markets Index captures large and mid cap representation across 24 frontier markets (FM) countries. The index includes 127 constituents, covering about 85% of the free float-adjusted market capitalization in each country.
The MSCI Japan Index is a free float-adjusted, market capitalization-weighted index that is designed to track the equity market performance of Japanese securities listed on Tokyo Stock Exchange, Osaka Stock Exchange, JASDAQ, and Nagoya Stock Exchange.
The MSCI U.S. REIT Index is a free float-adjusted market capitalization index that is comprised of equity REITs. The index is based on MSCI USA Investable Market Index (IMI), its parent index that captures large, mid, and small caps securities. With 139 constituents, it represents about 99% of the U.S. REIT universe and securities are classified in the REIT sector according to the Global Industry Classification Standard (GICS). It, however, excludes mortgage REITs and selected specialized REITs.
The Russell 1000 Index measures the performance of the large cap segment of the U.S. equity universe. It is a subset of the Russell 3000 Index and includes approximately 1000 of the largest securities based on a combination of their market cap and current index membership. The Russell 1000 represents approximately 92% of the U.S. market.
The Russell 1000 Value Index measures the performance of the large cap value segment of the U.S. equity universe.
The Russell 1000 Growth Index measures the performance of the large cap growth segment of the U.S. equity universe.
The Russell 2000 Index measures the performance of the small cap segment of the U.S. equity universe. The Russell 2000 Index is a subset of the Russell 3000 Index representing approximately 10% of the total market capitalization of that index.
The Russell 2000 Growth Index measures the performance of those Russell 2000 companies with higher price-to-book ratios and higher forecasted growth values.
The Russell 2000 Value Index measures the performance of those Russell 2000 companies with lower price-to-book ratios and lower forecasted growth values.
The Russell 2500 Index is a broad index featuring 2,500 stocks that cover the small and mid cap market capitalizations. The Russell 2500 is a market capitalization-weighted index that includes the smallest 2,500 companies covered in the Russell 3000 universe of U.S.-based listed equities.
The Russell 3000 Index measures the performance of the largest 3,000 U.S. companies representing approximately 98% of the investable U.S. equity market.
The Russell 3000 Growth Index measures the performance of the broad growth segment of the U.S. equity universe. It includes those Russell 3000 companies with higher price-to-book ratios and higher forecasted growth values.
The Russell 3000 Value Index measures the performance of the broad value segment of U.S. equity value universe. It includes those Russell 3000 companies with lower price-to-book ratios and lower forecasted growth values.
The Russell Microcap Index measures the performance of the microcap segment of the U.S. equity market. Microcap stocks make up less than 3% of the U.S. equity market (by market cap) and consist of the smallest 1,000 securities in the small-cap Russell 2000 Index, plus the next 1,000 smallest eligible securities by market cap.
The Russell Midcap Index offers investors access to the mid cap segment of the U.S. equity universe. The Russell Midcap Index is constructed to provide a comprehensive and unbiased barometer for the mid cap segment and is completely reconstituted annually to ensure that larger stocks do not distort the performance and characteristics of the true mid cap opportunity set. The Russell Midcap Index includes the smallest 800 securities in the Russell 1000.
The Russell Midcap Growth Index offers investors access to the mid cap growth segment of the U.S. equity universe.
The Russell Midcap Growth Index is constructed to provide a comprehensive and unbiased barometer of the mid cap growth market. Based on ongoing empirical research of investment manager behavior, the methodology used to determine growth probability approximates the aggregate mid cap growth manager’s opportunity set.
The Russell Midcap Value Index offers investors access to the mid cap value segment of the U.S. equity universe. The Russell Midcap Value Index is constructed to provide a comprehensive and unbiased barometer of the mid cap value market. Based on ongoing empirical research of investment manager behavior, the methodology used to determine value probability approximates the aggregate mid cap value manager’s opportunity set.
The S&P 500 Index is a capitalization-weighted index of 500 stocks designed to measure performance of the broad domestic economy through changes in the aggregate market value of 500 stocks representing all major industries.
The S&P Global Infrastructure Index is comprised of 75 of the largest publicly listed infrastructure companies that meet specific investability requirements. The index is designed to provide liquid exposure to the leading publicly listed companies in the global infrastructure industry, from both developed markets and emerging markets.
The S&P Utilities Index is comprised primarily of companies involved in water and electrical power and natural gas distribution industries.
The S&P Developed Ex-U.S. Property defines and measures the investable universe of publicly traded property companies domiciled in developed countries outside of the U.S. The companies included are engaged in real estate related activities, such as property ownership, management, development, rental and investment.
The USD Index measures the performance of the U.S. dollar against a basket of foreign currencies: EUR, JPY, GBP, CAD, CHF and SEK. The U.S. Dollar Index goes up when the dollar gains “strength” compared to other currencies.
This research material has been prepared by LPL Financial LLC.
To the extent you are receiving investment advice from a separately registered independent investment advisor, please note that LPL Financial LLC is not an affiliate of and makes no representation with respect to such entity.
Not FDIC or NCUA/NCUSIF Insured | No Bank or Credit Union Guarantee | May Lose Value | Not Guaranteed by Any Government Agency | Not a Bank/Credit Union Deposit
Tracking #1-465129 (Exp. 02/17