
KEY TAKEAWAYS
- A low-return environment persists for bond investors.
- Even after a third quarter bounce back, the Barclays Aggregate Bond Index is up just over 1% year to date.
- Lingering U.S. economic uncertainty may provide near-term support for high-quality bond prices.
Click here to download a PDF of this report.
FOURTH QUARTER BOND OUTLOOK
Third quarter bond market trends may continue to start the fourth quarter. A weaker than expected September jobs report and a soft reading on the Institute for Supply Management (ISM) manufacturing Purchasing Managers’ Index (PMI) for September raised questions about the strength of the domestic economy and pushed back expectations of a Federal Reserve (Fed) rate hike. The signal from these two top-tier indicators is caution, which may continue to be supportive of high-quality bonds.
High-quality bonds may hold recent gains, or even extend them until more economic data clarify the pace of economic growth. Proof will likely be required as to whether ISM and jobs data are reflective of an economic slowdown (or worse) or simply month-to-month volatility that often accompanies economic data releases. This may take a month or longer as investors await confirmation via the monthly employment report for October, which will not be released until early November.
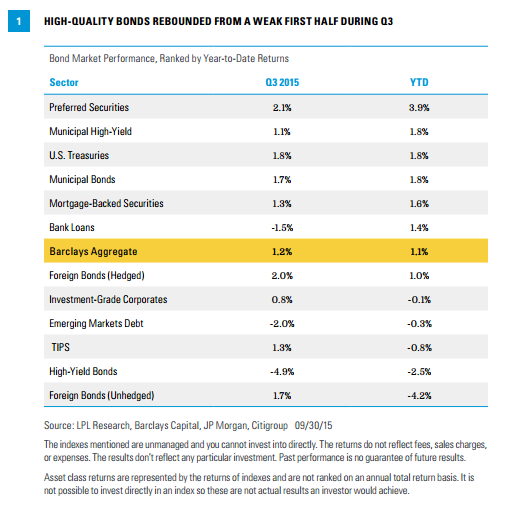
The cautionary tone was a microcosm of the entire third quarter and reflected in bond performance. The mix of bond returns flip-flopped during the third quarter compared with the second quarter of 2015. Treasury strength helped high-quality bonds rebound from a weak first half of 2015, while high-yield bonds and more economically sensitive sectors such as emerging markets debt and bank loans also lagged over the third quarter [Figure 1]. Lower oil prices, China fears, and domestic economic concerns weighed on more economically sensitive sectors.
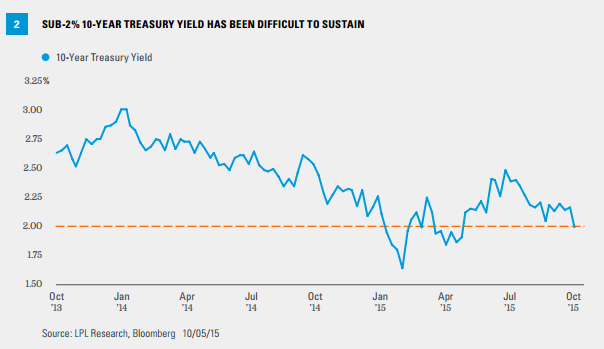
Although the mix of bond returns changed, the low-return environment facing investors is unlikely to change as we begin the fourth quarter of 2015. Even with the rebound in high-quality bond prices, the total return of the broad Barclays Aggregate Bond Index stands at just over 1% year to date through the end the third quarter. Treasury strength pushed the 10-year Treasury yield down to just below 2% at the end of last week, but sub-2% 10-year yields have not been sustained for any meaningful period of time since 2012 and 2013 [Figure 2]. The 2% yield barrier caused investors to reconsider expensive valuations in the past and confronts investors again.
A cloud of economic uncertainty may remain supportive of high-quality bonds, but an additional catalyst is likely needed for Treasury prices to rise further or yields to fall further. Treasury strength last week (September 28 – October 2, 2015), where yields fell by 0.13% to 0.20% across the board, shows the market was quick to assimilate the negative news. Furthermore, a first Fed interest rate hike is not fully priced in until June 2016 according to fed fund futures–compared with December 2015 for much of the summer. Still, softer economic data–either in the form of upcoming retail sales data or corporate earnings season, which begins this week–are likely needed to push high-quality bond prices meaningfully higher. Further weakness from future ISM manufacturing PMIs or employment reports would also suffice to drive additional bond strength. But continued strength in big ticket consumer purchases, such as autos and homes, run counter to the concept of a looming recession and suggest data must deteriorate further to power another round of Treasuries gains.
FINDING VALUE
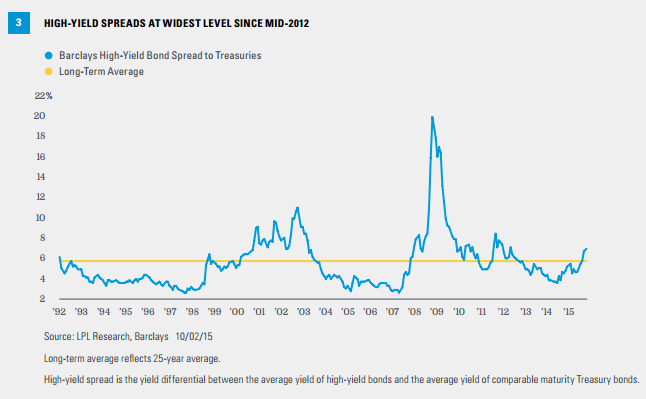
We believe value exists among third quarter laggards and negative sentiment in the high-yield bond sector may have gone too far. We find the sector more attractive given the cheaper valuations. As of October 2, 2015, the average yield spread of high-yield bonds stood at 6.9%, the highest level since mid-2012, and just under 7%, which has historically provided an attractive risk-reward for investors [Figure 3]. When the average yield spread of high-yield bonds has been 7% or greater, the following average one-year total return has averaged 17.5%, with a 79% probability of a positive return.* We do not expect a return anywhere near the 17.5% average of prior periods when yield spreads were at or above current levels, due to the prospect of gradually rising defaults. However, cheaper valuations and an average yield of just over 8% offer an attractive opportunity for suitable investors, which we believe compensates for potential risks.
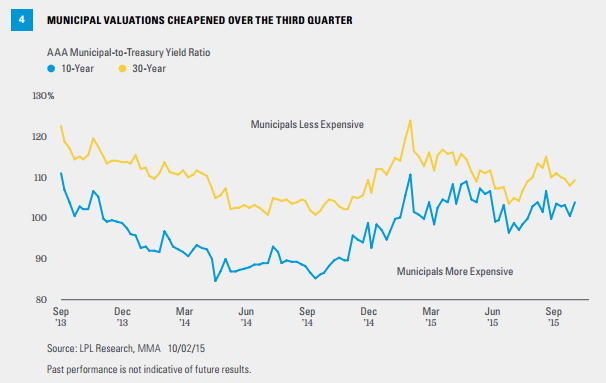
Municipal bonds benefited from high-quality bond strength but, after outperforming during the first half of 2015, lagged Treasuries during the third quarter.** Municipal bonds will likely continue to take their cues from the Treasury market, but cheaper valuations [Figure 4] may provide a layer of protection in the event of high-quality weakness. Average AAA municipal-to-Treasury yield ratios increased during the third quarter with 10- and 30-year ratios firmly above 100% (indicating top-quality municipal bonds yield more than comparable maturity Treasuries). Cheaper valuations translate to more attractive after-tax yields and municipals present slightly better value in a still challenging environment for bonds.
CONCLUSION
High-quality bonds finished the third quarter on a strong note, but bond prices moved quickly to price in disappointing economic reports. Economic uncertainty may linger over the very short term, providing support to high-quality bond prices; however, the low-return environment confronting investors has not changed even if the composition of bond returns did over the third quarter. We find opportunity among third quarter laggards in what is still a challenging return environment for fixed investors.
*Based on Barclays High Yield Corporate Index total return data from January 1990 through the present.
**As measured by Barclays Municipal Bond Index and Barclays Treasury Index.
IMPORTANT DISCLOSURES
The opinions voiced in this material are for general information only and are not intended to provide specific advice or recommendations for any individual. To determine which investment(s) may be appropriate for you, consult your financial advisor prior to investing. All performance reference is historical and is no guarantee of future results. All indexes are unmanaged and cannot be invested into directly.
The economic forecasts set forth in the presentation may not develop as predicted and there can be no guarantee that strategies promoted will be successful.
Bonds are subject to market and interest rate risk if sold prior to maturity. Bond values and yields will decline as interest rates rise, and bonds are subject to availability and change in price.
Government bonds and Treasury bills are guaranteed by the U.S. government as to the timely payment of principal and interest and, if held to maturity, offer a fixed rate of return and fixed principal value. However, the value of fund shares is not guaranteed and will fluctuate.
Municipal bonds are subject to availability, price, and to market and interest rate risk if sold prior to maturity. Bond values will decline as interest rates rise. Interest income may be subject to the alternative minimum tax. Federally tax-free but other state and local taxes may apply.
High-yield/junk bonds are not investment-grade securities, involve substantial risks, and generally should be part of the diversified portfolio of sophisticated investors.
DEFINITIONS
The Institute for Supply Management (ISM) index is based on surveys of more than 300 manufacturing firms by the Institute for Supply Management. The ISM manufacturing index monitors employment, production inventories, new orders, and supplier deliveries. A composite diffusion index is created that monitors conditions in national manufacturing based on the data from these surveys.
Purchasing Managers’ Indexes (PMI) are economic indicators derived from monthly surveys of private sector companies, and are intended to show the economic health of the manufacturing sector. A PMI of more than 50 indicates expansion in the manufacturing sector, a reading below 50 indicates contraction, and a reading of 50 indicates no change. The two principal producers of PMIs are Markit Group, which conducts PMIs for over 30 countries worldwide, and the Institute for Supply Management (ISM), which conducts PMIs for the U.S.
INDEX DESCRIPTIONS
The Barclays U.S. Aggregate Bond Index is a broad-based flagship benchmark that measures the investment-grade, U.S. dollar-denominated, fixed-rate taxable bond market. The index includes Treasuries, government-related and corporate securities, MBS (agency fixed-rate and hybrid ARM pass-throughs), ABS, and CMBS (agency and non-agency).
Barclays U.S. High Yield Loan Index tracks the market for dollar-denominated floating-rate leveraged loans. Instead of individual securities, the U.S. High Yield Loan Index is composed of loan tranches that may contain multiple contracts at the borrower level.
The Barclays U.S. Corporate High Yield Index measures the market of USD-denominated, noninvestment-grade, fixed-rate, taxable corporate bonds. Securities are classified as high yield if the middle rating of Moody’s, Fitch, and S&P is Ba1/BB+/BB+ or below, excluding emerging market debt.
The Barclays U.S. Corporate Index is a broad-based benchmark that measures the investment-grade, U.S. dollar-denominated, fixed-rate, taxable corporate bond market.
The Barclays U.S. Mortgage Backed Securities (MBS) Index tracks agency mortgage backed pass-through securities (both fixed rate and hybrid ARM) guaranteed by Ginnie Mae (GNMA), Fannie Mae (FNMA), and Freddie Mac (FHLMC)
The Barclays U.S. Municipal Index covers the USD-denominated long-term tax-exempt bond market. The index has four main sectors: state and local general obligation bonds, revenue bonds, insured bonds, and pre-refunded bonds.
The Barclays Municipal High Yield Bond Index is comprised of bonds with maturities greater than one-year, having a par value of at least $3 million issued as part of a transaction size greater than $20 million, and rated no higher than ‘BB+’ or equivalent by any of the three principal rating agencies.
The Barclays U.S. Treasury Index is an unmanaged index of public debt obligations of the U.S. Treasury with a remaining maturity of one year or more. The index does not include T-bills (due to the maturity constraint), zero coupon bonds (strips), or Treasury Inflation-Protected Securities (TIPS).
The Citi World Government Bond Index (WGBI) measures the performance of fixed-rate, local currency, investment-grade sovereign bonds. The WGBI is a widely used benchmark that currently comprises sovereign debt from over 20 countries, denominated in a variety of currencies, and has more than 25 years of history available. The WGBI provides a broad benchmark for the global sovereign fixed income market. Subindexes are available in any combination of currency, maturity, or rating.
The JP Morgan Emerging Markets Bond Index is a benchmark index for measuring the total return performance of international government bonds issued by emerging markets countries that are considered sovereign (issued in something other than local currency) and that meet specific liquidity and structural requirements.
This research material has been prepared by LPL Financial.
To the extent you are receiving investment advice from a separately registered independent investment advisor, please note that LPL Financial is not an affiliate of and makes no representation with respect to such entity.
Not FDIC or NCUA/NCUSIF Insured | No Bank or Credit Union Guarantee | May Lose Value | Not Guaranteed by Any Government Agency | Not a Bank/Credit Union Deposit
Tracking #1-427532 (Exp. 10/16)