
KEY TAKEAWAYS
- Historically, the first six months following the start of rate hikes have been the most challenging, with the average performance improving one year after the start.
- More economically sensitive issues, like corporate bonds, high-yield bonds, and emerging markets debt, along with global bonds, have historically weathered rising rates well; but today’s market backdrop suggests a potentially different outcome.
Click here to download a PDF of this report.
FED RATE HIKE PLAYBOOK: PART 1
The Federal Reserve’s (Fed) first rate hike in nine years is officially history, and a look back at prior interest rate hike periods may help bond investors decide how to position portfolios for 2016 and beyond. History does not always repeat, and we evaluate which trends may recur and where history may differ as additional rate hikes approach. We will explore the impact on municipal bonds in Part 2 at a later date.
BROAD BOND MARKET
Figure 1 illustrates broad bond market performance 6, 12, and 18 months after the Fed’s first rate hike during the last three rate hike tightening cycles. The first six months of the rate hike cycle are typically the most challenging and a big reason why we expect another low-return environment for bonds, as described in our Outlook 2016 publication. The average return for domestic high-quality bonds, across the last three cycles, is just 0.5% during the first six months after the Fed’s first rate hike.
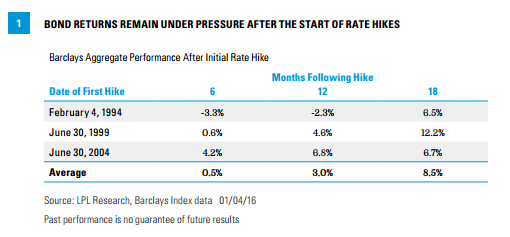
Average performance improves after one year as bond prices stabilize, but all three periods–1994, 1999, and 2004–had specific circumstances that drove performance. The 1994 campaign was one of the Fed’s more aggressive, which led to a full year of losses, while the 1999 campaign witnessed the early signals of an economic slowdown within months of the Fed raising the overnight borrowing rate to 6.5%. The 2004 cycle witnessed a global savings glut, which, aided by a high-yield bond scare, led to steady buying of longer-dated bonds, helping to support longer-term high-quality bond prices.
An economic slowdown brought on by higher interest rates has historically led to renewed bond strength into the second year of rate hikes. The Fed’s medicine ultimately works, and high-quality bond performance has been strong 18 months following a rate hike, with an average return of 8.5%. This pattern is fairly uniform across all three rate hike cycles, but a high-single-digit return may be unlikely in the current lower-yielding environment. However, should the Fed’s rate hikes slow the economy too much, a mid-single-digit annualized return could be possible, as future rate hikes become less likely and growth and inflation expectations decline.
Where History May Repeat
- A challenging, low-return environment may repeat over the first six months and the historical 0.5% return may provide a blueprint for the first half of 2016.
Where History Is Likely to Differ
- We do not expect a repeat of the 1994 bear market or the unique factors that bolstered 1999 and 2004 returns. Returns may fall slightly short of the 3.0% one-year average due to higher valuations and lower yields in the current market.
- An economic slowdown brought on by higher rates could lead to an improvement in bond returns in 2017, but lower yields suggest a rebound to high-single-digit returns is unlikely.
Investment Takeaway
- Consider maintaining a lower than average interest rate sensitivity. This objective can be pursued by either avoiding longer-term bonds or holding a reduced allocation to bonds.
BOND SECTORS
Identifying bond sectors that have historically fared better during prior rate hike cycles is another strategy investors can employ to navigate Fed rate hike environments. Figure 2 illustrates average returns of the major bond sectors over the same 6-, 12-, and 18-month time periods during rate hikes that began in 1994, 1999, and 2004, respectively.
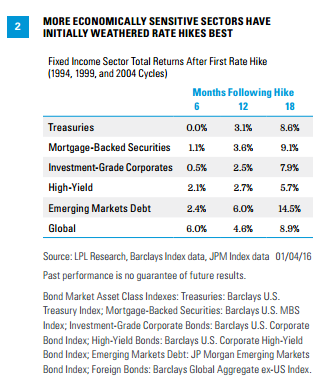
Treasuries have historically lagged during the six-month period after the first rate hike. Because Treasuries are the most sensitive to interest rate changes, the results are not very surprising. Furthermore, as rate hikes usually come in response to better economic growth, more economically sensitive high-yield bonds and emerging markets debt (EMD) have also weathered the start of rate hikes better than most bond sectors.
High-quality global bonds have been the strongest performing sector following a first rate hike, but that average return is skewed by an impressive 15% return during the first six months of the 2004 cycle and further strength after one year.1 A weaker U.S. dollar also helped spark big foreign bond gains, something we do not expect to repeat in the current cycle.
Among high-quality bonds, mortgage-backed securities (MBS) were a consistent leader, and strength was also evident among both EMD and global bonds throughout the 6-, 12-, and 18-month periods.
Like the broad bond market, returns improved for most sectors after 18 months. However, the economic slowdown that developed in response to rate hikes prompted both investment-grade and high-yield corporate bonds to lag higher quality options.
Where History May Repeat
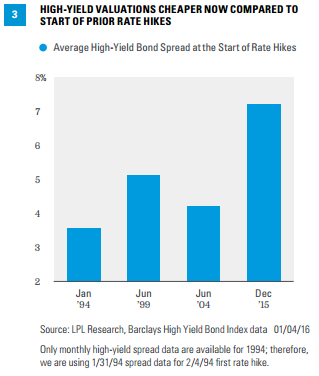
- We expect corporate bonds, especially high-yield bonds, to weather Fed rate hikes better, and 2015 weakness puts both in a position to do so. Average valuations of high-yield bonds began this rate hike cycle cheaper than at the start of prior rate hike cycles [Figure 3].
- The notable outlier in high-yield performance in rate hike periods is the 1999 cycle, when weakness in telecom spread throughout the high-yield market. Although high-yield energy still represents approximately 11% of today’s high-yield market, that share is nowhere close to telecom’s 34% share in 1999.2 We believe the 1999 period is an exception unless a recession ensues (which we do not expect), and high-yield may outperform the Barclays Aggregate.
Where History Is Likely to Differ
- Strong outperformance by global bonds is highly unlikely to be repeated. The Fed intends to keep raising rates, but foreign central banks, notably the Bank of Japan and European Central Bank (ECB), may continue to ease and dollar strength may persist. Foreign bond yields are also lower than comparable U.S. yields, the opposite condition of the mid-2000s. Global bonds, hedged for currency movements, are an alternative consideration as a potential method to capture central bank divergence.
- Dollar-denominated EMD, on average, has fared well during periods of rate hikes relative to the Barclays Aggregate, but average returns mask significant volatility. EMD underperformed domestic high-quality bonds by 16-20% over 6-, 12-, and 18-month periods in 2004, but outperformed by 10-19% over all three time frames in both the 1999 and 2004 cycles.3 The EMD market was very different in prior cycles and inherent credit quality was lower. With valuations higher (due to economic improvement over the past two decades) and yields notably lower, a repeat of EMD performance is unlikely.
Investment Takeaway
- Absent a U.S. recession, attractive valuations for corporate bonds, both investment-grade and high-yield, may help investors manage the rising rate environment.
CONCLUSION
As the saying goes, history does not always repeat but it often rhymes. The economic and central bank policy environment characterizing today’s financial markets is unique, yet history may provide a rough but useful guide to managing the current Fed rate hike cycle.
1 According to Barclays Global Aggregate Bond Index ex-US.
2 Per the Barclays High Yield Index.
3 Per JP Morgan Emerging Markets Bond Index.
IMPORTANT DISCLOSURES
The opinions voiced in this material are for general information only and are not intended to provide or be construed as providing specific investment advice or recommendations for any individual security. To determine which investments may be appropriate for you, consult your financial advisor prior to investing. All performance referenced is historical and is no guarantee of future results. All indexes are unmanaged and cannot be invested into directly.
The economic forecasts set forth in the presentation may not develop as predicted and there can be no guarantee that strategies promoted will be successful.
Bonds are subject to market and interest rate risk if sold prior to maturity. Bond values and yields will decline as interest rates rise, and bonds are subject to availability and change in price.
Government bonds and Treasury bills are guaranteed by the U.S. government as to the timely payment of principal and interest and, if held to maturity, offer a fixed rate of return and fixed principal value. However, the value of fund shares is not guaranteed and will fluctuate.
Corporate bonds are considered higher risk than government bonds but normally offer a higher yield and are subject to market, interest rate, and credit risk as well as additional risks based on the quality of issuer coupon rate, price, yield, maturity, and redemption features.
Mortgage-backed securities are subject to credit, default risk, prepayment risk (that acts much like call risk when you get your principal back sooner than the stated maturity), extension risk, the opposite of prepayment risk, and interest rate risk.
High-yield/junk bonds (grade BB or below) are not investment grade securities, and are subject to higher interest rate, credit, and liquidity risks than those graded BBB and above. They generally should be part of a diversified portfolio for sophisticated investors.
International debt securities involves special additional risks. These risks include, but are not limited to, currency risk, geopolitical and regulatory risk, and risk associated with varying settlement standards. These risks are often heightened for investments in emerging markets.
INDEX DESCRIPTIONS
The Barclays U.S. Aggregate Bond Index is a broad-based flagship benchmark that measures the investment-grade, U.S. dollar-denominated, fixed-rate taxable bond market. The index includes Treasuries, government-related and corporate securities, MBS (agency fixed-rate and hybrid ARM pass-throughs), ABS, and CMBS (agency and non-agency).
The Barclays U.S. Corporate High Yield Index measures the market of USD-denominated, noninvestment-grade, fixed-rate, taxable corporate bonds. Securities are classified as high yield if the middle rating of Moody’s, Fitch, and S&P is Ba1/BB+/BB+ or below, excluding emerging market debt.
The Barclays U.S. Corporate Index is a broad-based benchmark that measures the investment-grade, U.S. dollar-denominated, fixed-rate, taxable corporate bond market.
The Barclays Global Aggregate Bond Index ex-US provides a broad-based measure of the global investment-grade fixed-rate debt markets. The two major components of this index are the Pan-European Aggregate, and the Asian-Pacific Aggregate indexes.
The JP Morgan Emerging Markets Bond Index is a benchmark index for measuring the total return performance of international government bonds issued by emerging markets countries that are considered sovereign (issued in something other than local currency) and that meet specific liquidity and structural requirements.
The Barclays U.S. Mortgage Backed Securities (MBS) Index tracks agency mortgage backed pass-through securities (both fixed rate and hybrid ARM) guaranteed by Ginnie Mae (GNMA), Fannie Mae (FNMA), and Freddie Mac (FHLMC).
The Barclays U.S. Treasury Index is an unmanaged index of public debt obligations of the U.S. Treasury with a remaining maturity of one year or more. The index does not include T-bills (due to the maturity constraint), zero coupon bonds (strips), or Treasury Inflation-Protected Securities (TIPS).
This research material has been prepared by LPL Financial.
To the extent you are receiving investment advice from a separately registered independent investment advisor, please note that LPL Financial is not an affiliate of and makes no representation with respect to such entity.
Not FDIC or NCUA/NCUSIF Insured | No Bank or Credit Union Guarantee | May Lose Value | Not Guaranteed by Any Government Agency | Not a Bank/Credit Union Deposit
Tracking #1-453499 (Exp. 01/17)