
Tomorrow is Friday the 13th, so what does this mean? Well, if you have triskaidekaphobia then this isn’t your day, as that is a fear of the number 13. A fear of the actual day of Friday the 13th is called paraskevidekatriaphobia orfriggatriskaidekaphobia.
In today’s blog we will look at what the S&P 500 has historically done on this well-hyped day. First things first, we would like to stress that this post is more fun in nature and in no way should a single calendar day influence your investment decisions. Getting to it, the last time we had a Friday the 13th was in November and the S&P 500 dropped 1.1%. After that day’s close were the Paris bombings, so this is a chance to remember our friends in France.
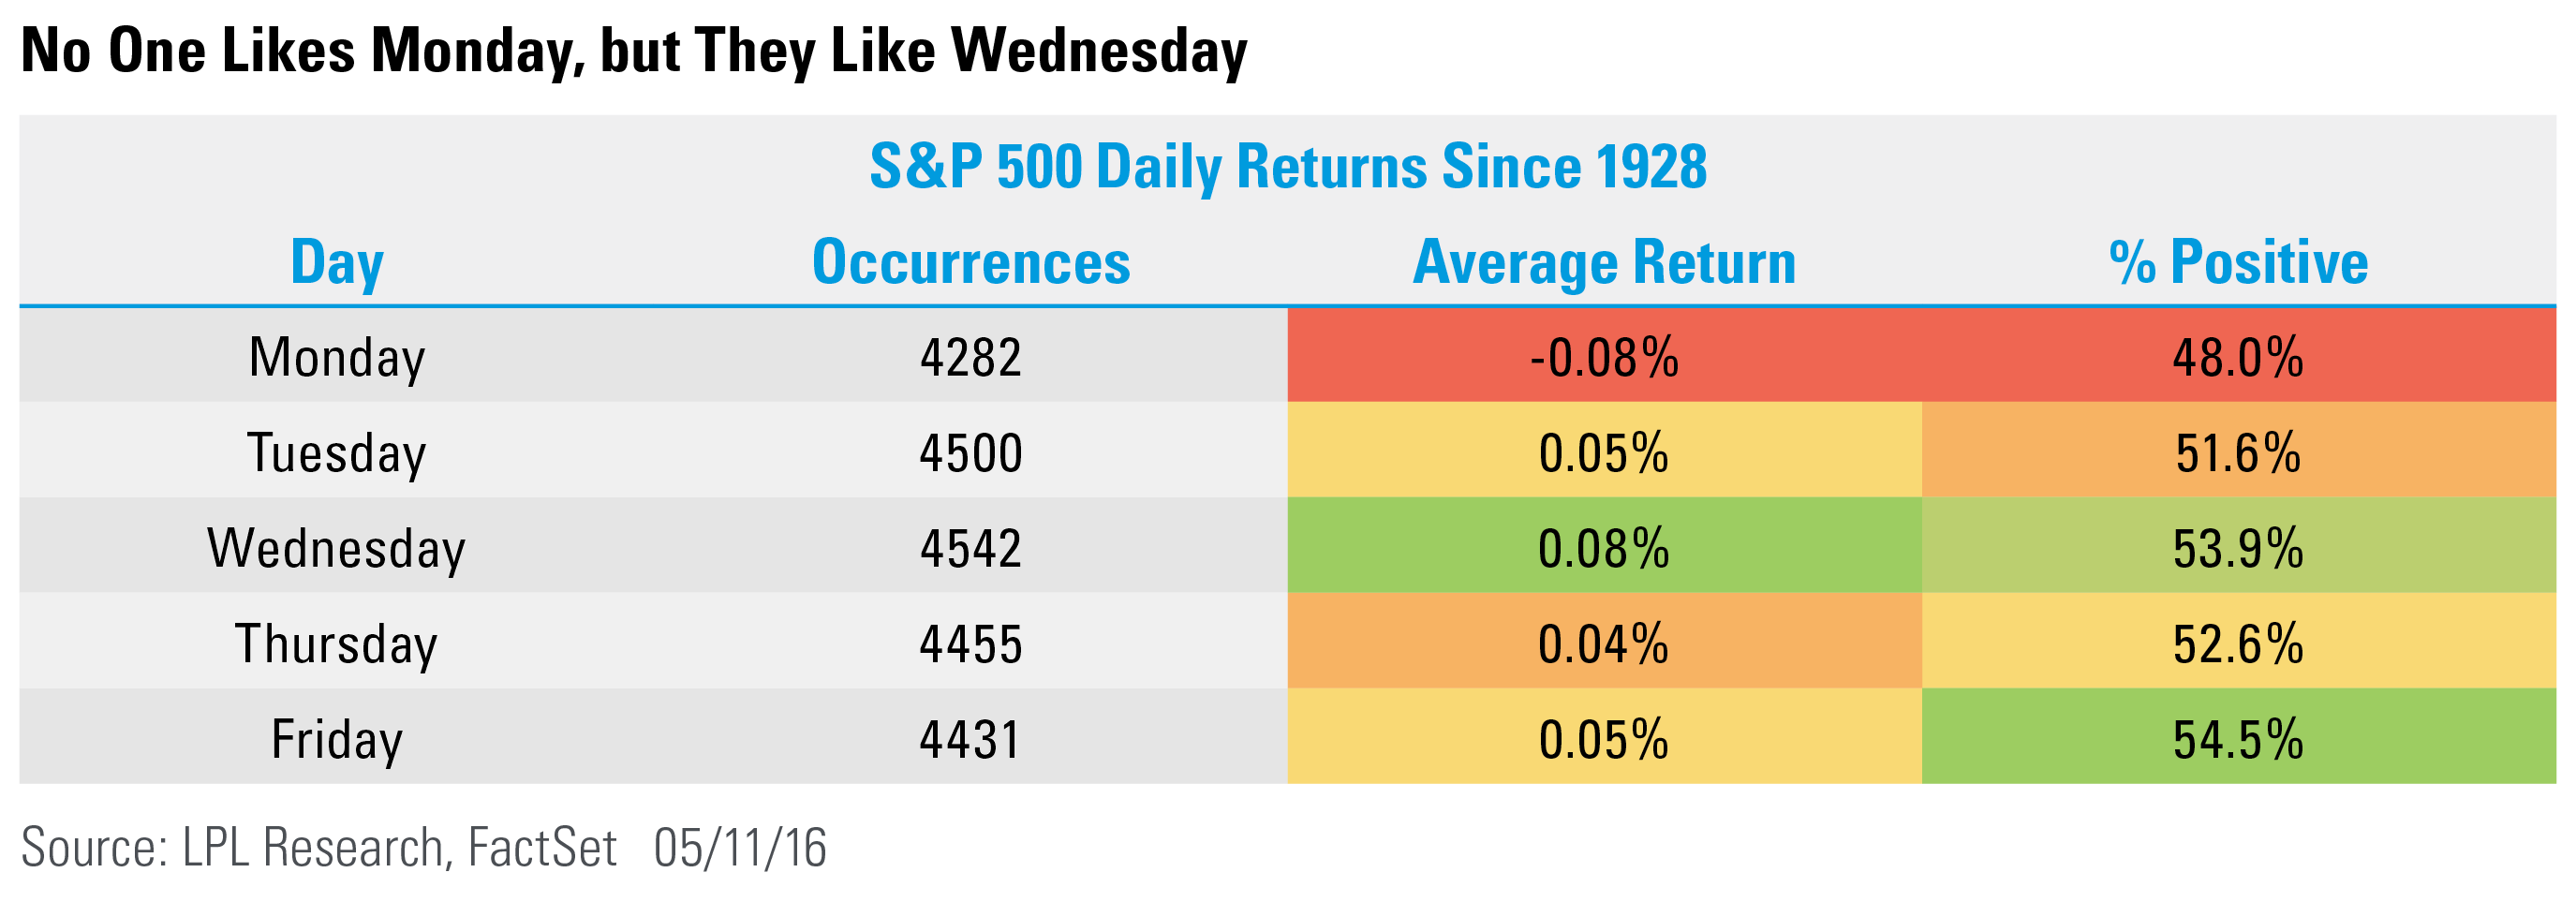
Here is a breakdown of how each day of the week has done since 1928 for the S&P 500. This is proof that no one likes Monday, as this day has been by far the worst. Wednesday sports the highest average return; yet, no day of the week is up more often than Friday.
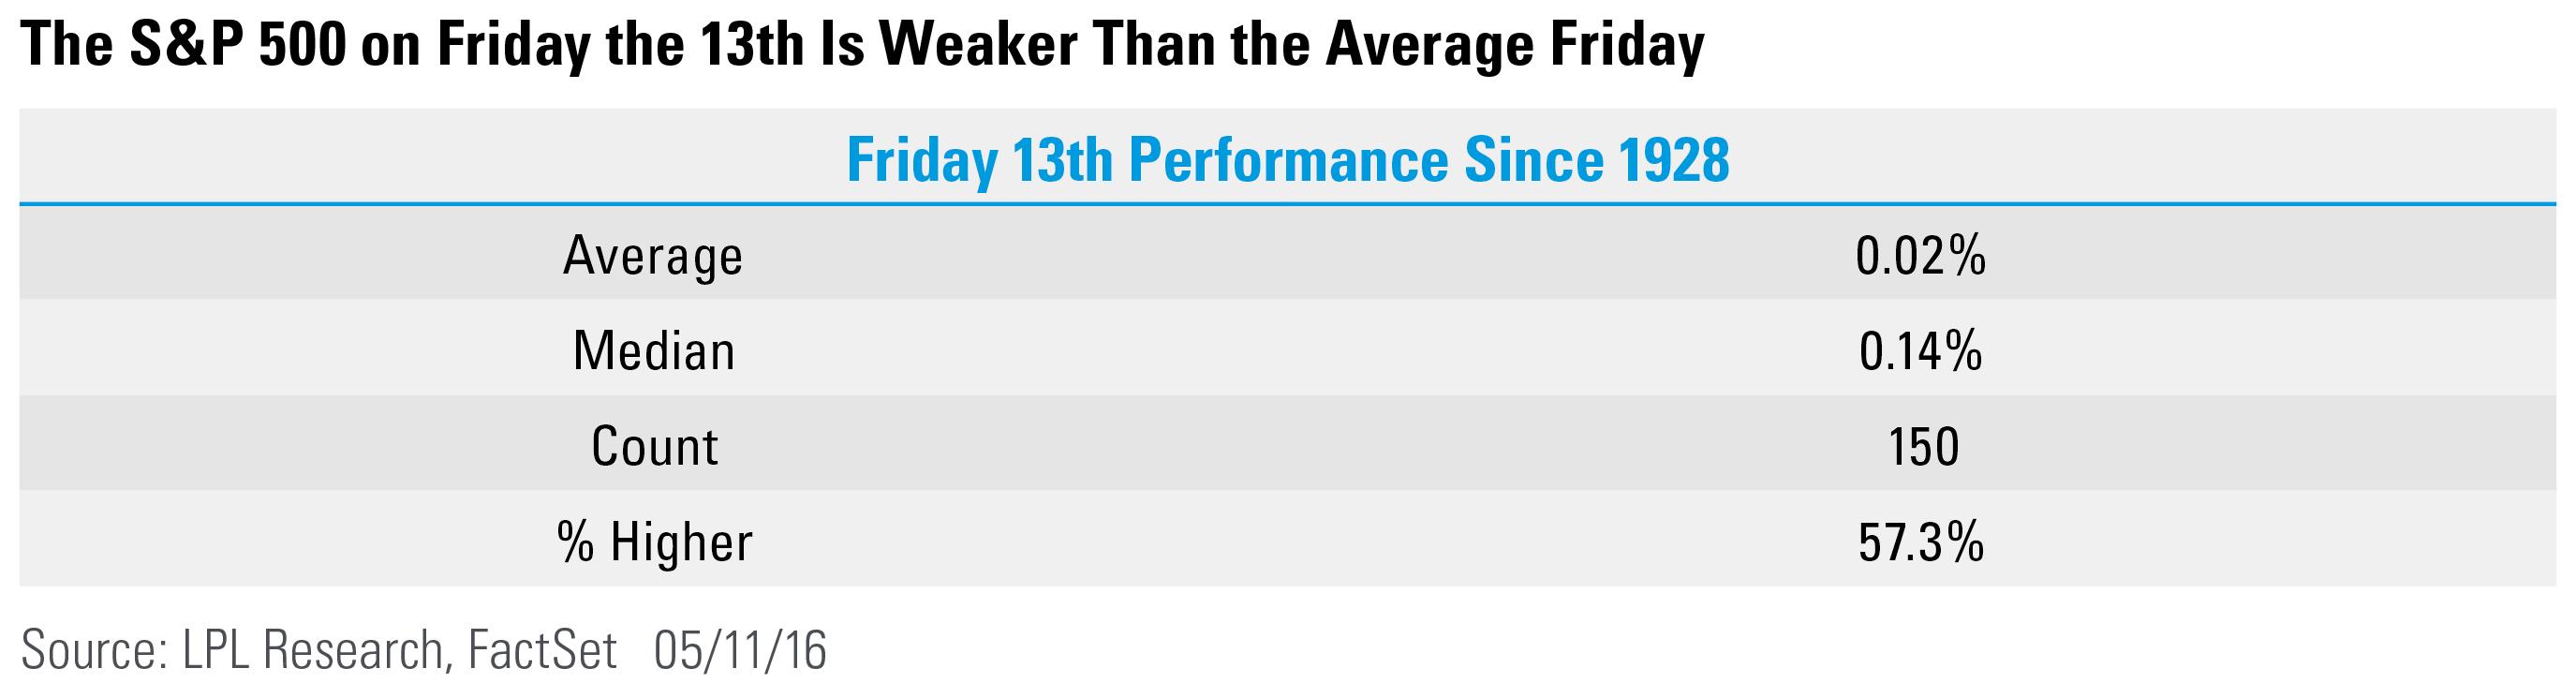
Looking specifically at Friday the 13th, there have been 150 of them going back to 1928 and the average return comes in at 0.02%. In other words, Friday the 13th is weaker than the average Friday. But it is worth noting that Friday the 13th is up 57.3% of the time, which is more than the average Friday.
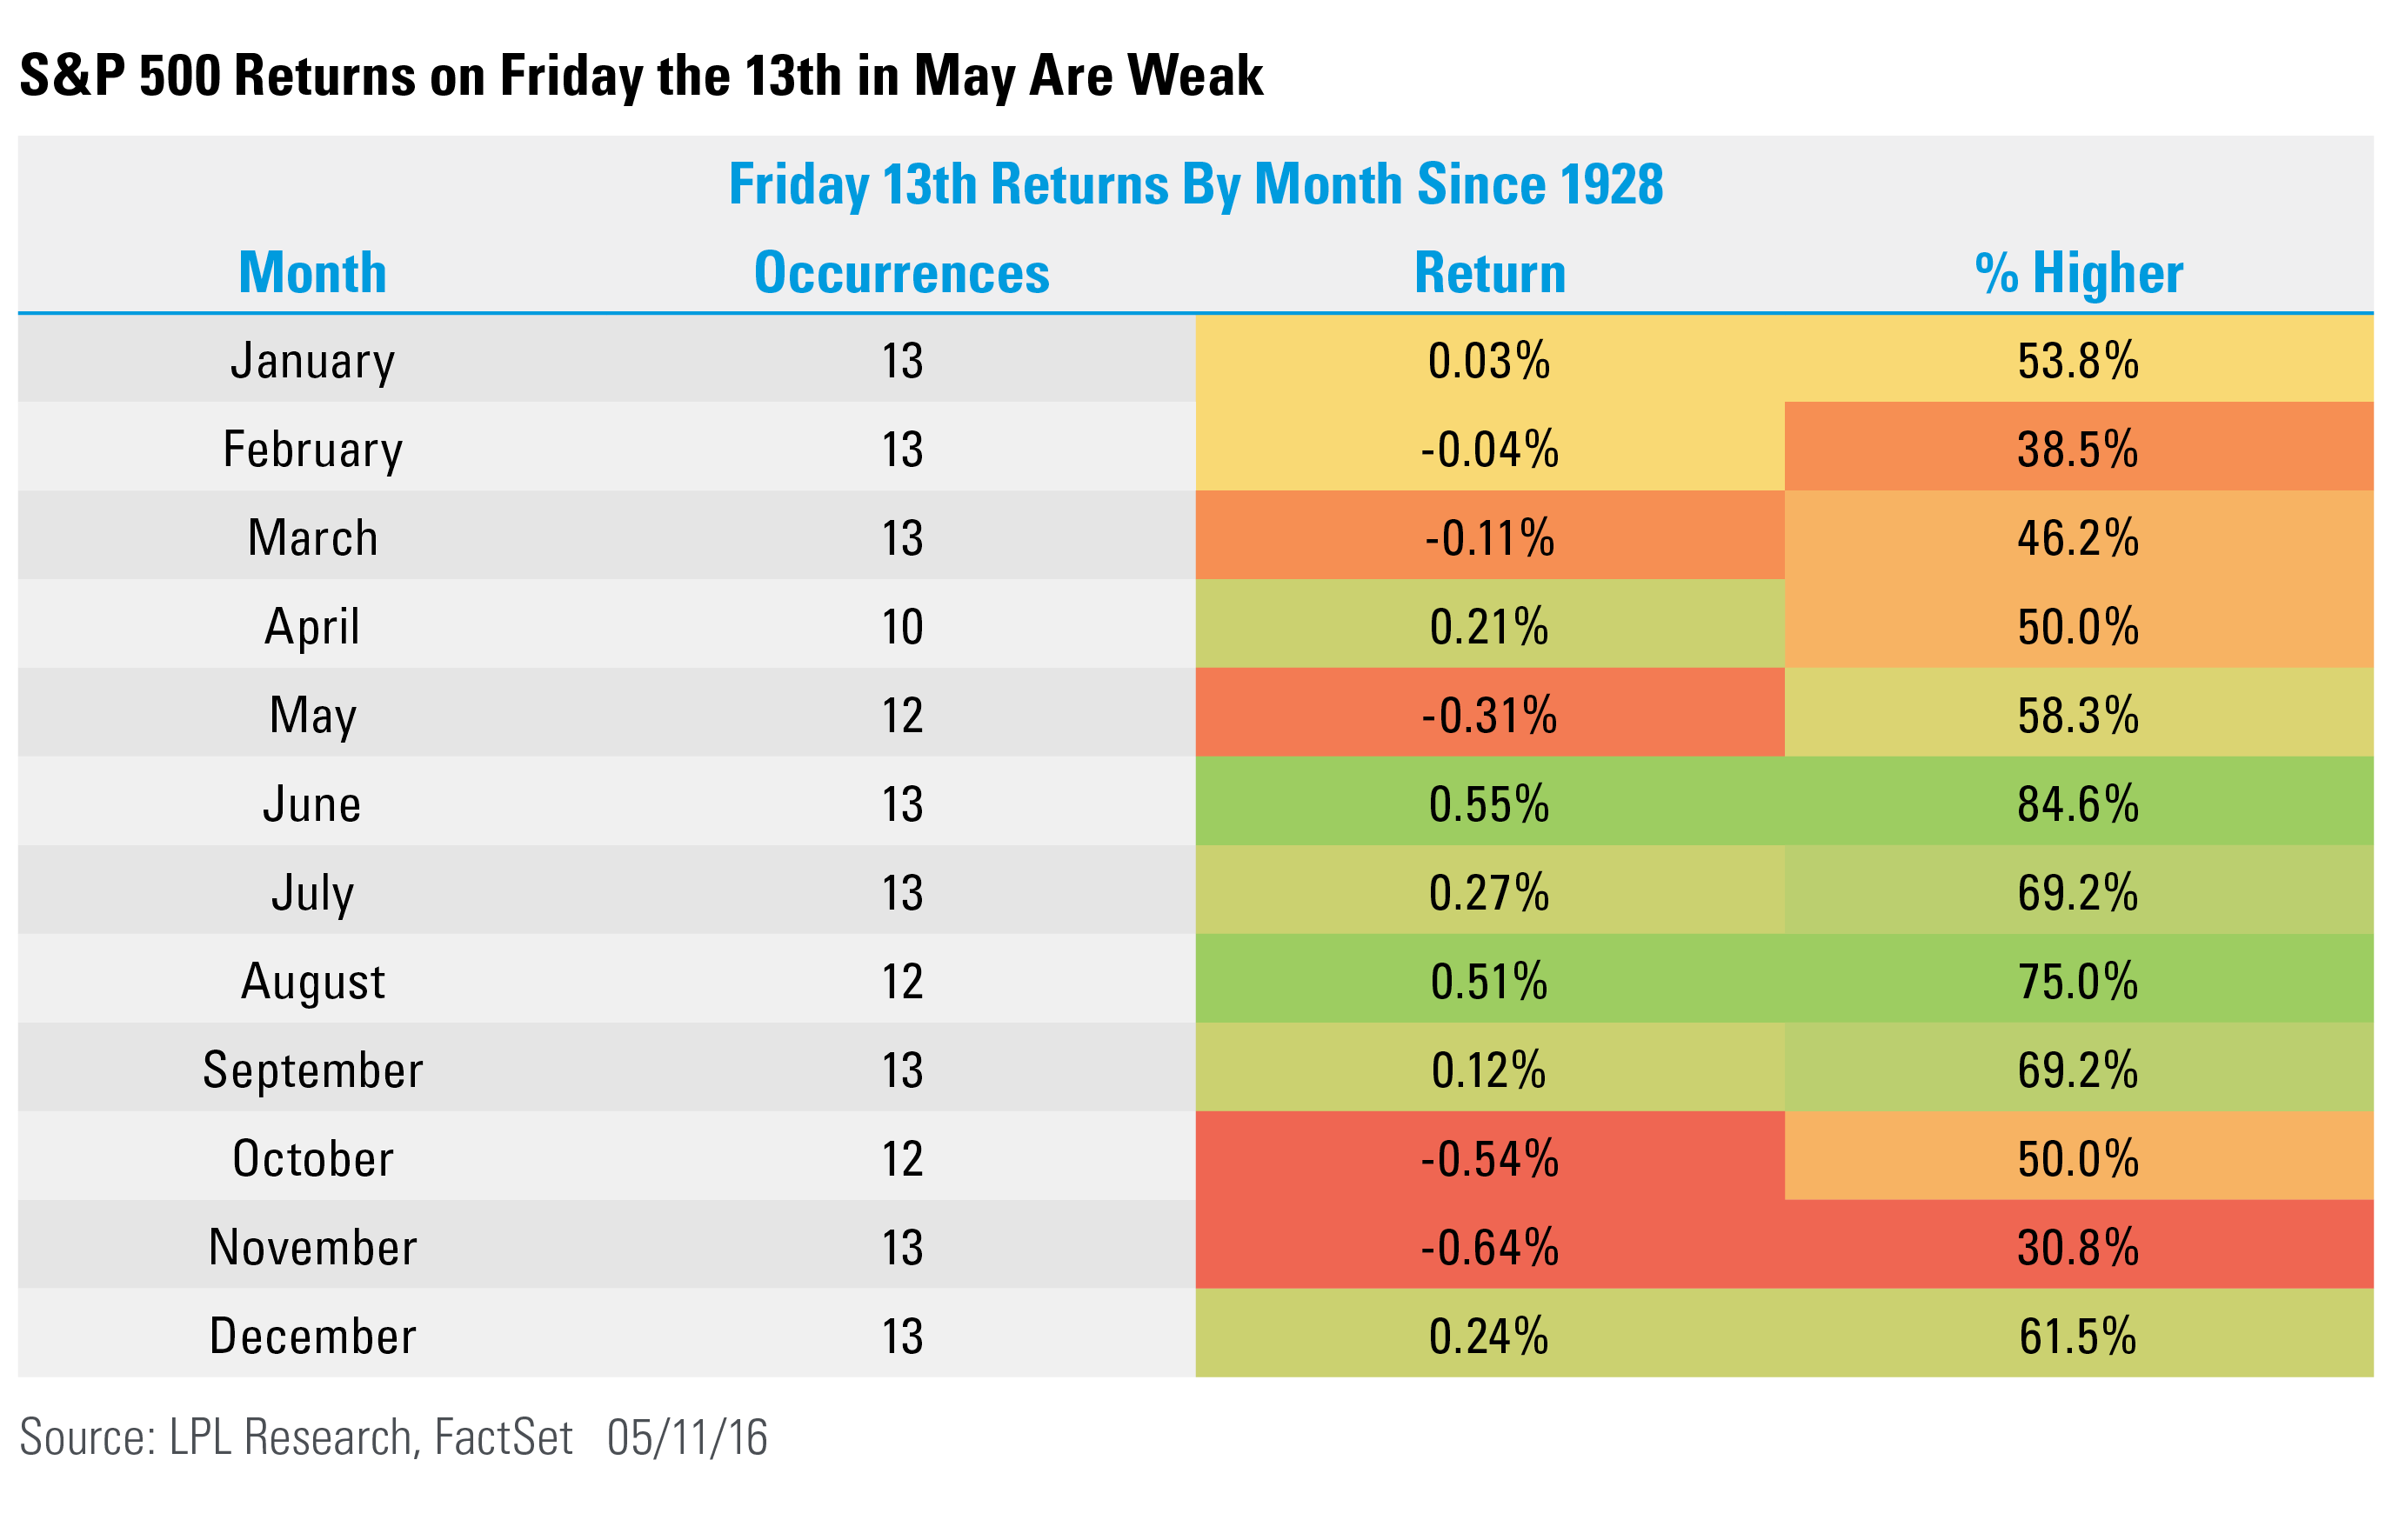
Lastly, breaking things down by months, tomorrow will be the 13th occurrence of Friday the 13th in May since 1928. What is interesting is Friday the 13th in May drops 0.31% on average, with only October and November worse on average. Friday the 13th in the summer months is when you shouldn’t fear this day, as those are the best returns on average.
Overall, don’t take any of this seriously. We don’t—but it is fun to examine. Here’s to a great Friday the 13th tomorrow.
IMPORTANT DISCLOSURES
Past performance is no guarantee of future results. All indexes are unmanaged and cannot be invested into directly. Unmanaged index returns do not reflect fees, expenses, or sales charges. Index performance is not indicative of the performance of any investment.
The economic forecasts set forth in the presentation may not develop as predicted.
The opinions voiced in this material are for general information only and are not intended to provide or be construed as providing specific investment advice or recommendations for any individual security.
Stock investing involves risk including loss of principal.
The S&P 500 Index is a capitalization-weighted index of 500 stocks designed to measure performance of the broad domestic economy through changes in the aggregate market value of 500 stocks representing all major industries.
This research material has been prepared by LPL Financial LLC.
To the extent you are receiving investment advice from a separately registered independent investment advisor, please note that LPL Financial LLC is not an affiliate of and makes no representation with respect to such entity.
Not FDIC/NCUA Insured | Not Bank/Credit Union Guaranteed | May Lose Value | Not Guaranteed by any Government Agency | Not a Bank/Credit Union Deposit
Securities and Advisory services offered through LPL Financial LLC, a Registered Investment Advisor
Member FINRA/SIPC
Tracking # 1-497222 (Exp. 05/17)