What a year it has been. The S&P 500 started things off down 10.5% for the first 28 days of the year, making 2016 the worst start to a year ever. As we noted at the time in our Weekly Market Commentary, “Data-Driven Perspective on a Rough Start to 2016,” bad starts to a year are not warnings of upcoming lower prices. Fortunately, that has played out well in 2016, as the S&P 500 has bounced all the way back and is currently up approximately 5.5% for the year (and just under 7% on a total return basis).
Now, this year has been anything but ordinary. In fact, the past few weeks have traded in a historically tight range. Think about these stats for a second:
- Using daily closes, for the last 13 days ending on Monday, the S&P 500 traded in 0.74% range—the tightest range since 0.68% in Aug 1995. The record is 0.58% in Nov 1964.
- Also for the last 13 days ending on Monday, the S&P 500 traded in a 1.04% range when using intraday highs and lows—the tightest 13-day range since November 1972.
- As of Monday, the S&P 500 hadn’t closed up or down more than 0.20% for 5 days, the longest streak since Nov 2014. It also hadn’t moved up or down more than 0.50% in 12 days, the longest since Aug 1995.
And here is another recent one to highlight—as this has never happened before:
- As of Monday, the Nasdaq was up for 5 days in a row and the Dow was down for 5 days in a row. This has never happened before. Last time it hit 4 in a row up for the Nasdaq and 4 in a row down for the Dow was January 2000. That, of course, was near the tech bubble peak.
Turning back to the worst starts of the year ever after 28 days, below is a chart that we shared in mid-February—but it is updated to include 2016 year to date. As you can see, 2016 is up 5.5% as of yesterday (the 147th trading day of the year). The other two years that started off poorly, but were up more than 2016 were 2009 (11.0%) and 1935 (16.2%). Both of those years continued to gain, with 2009 finishing up 23.5% and 1935 up 41.4%. The big question is: Could this be a small clue that higher prices are in store for the rest of 2016?
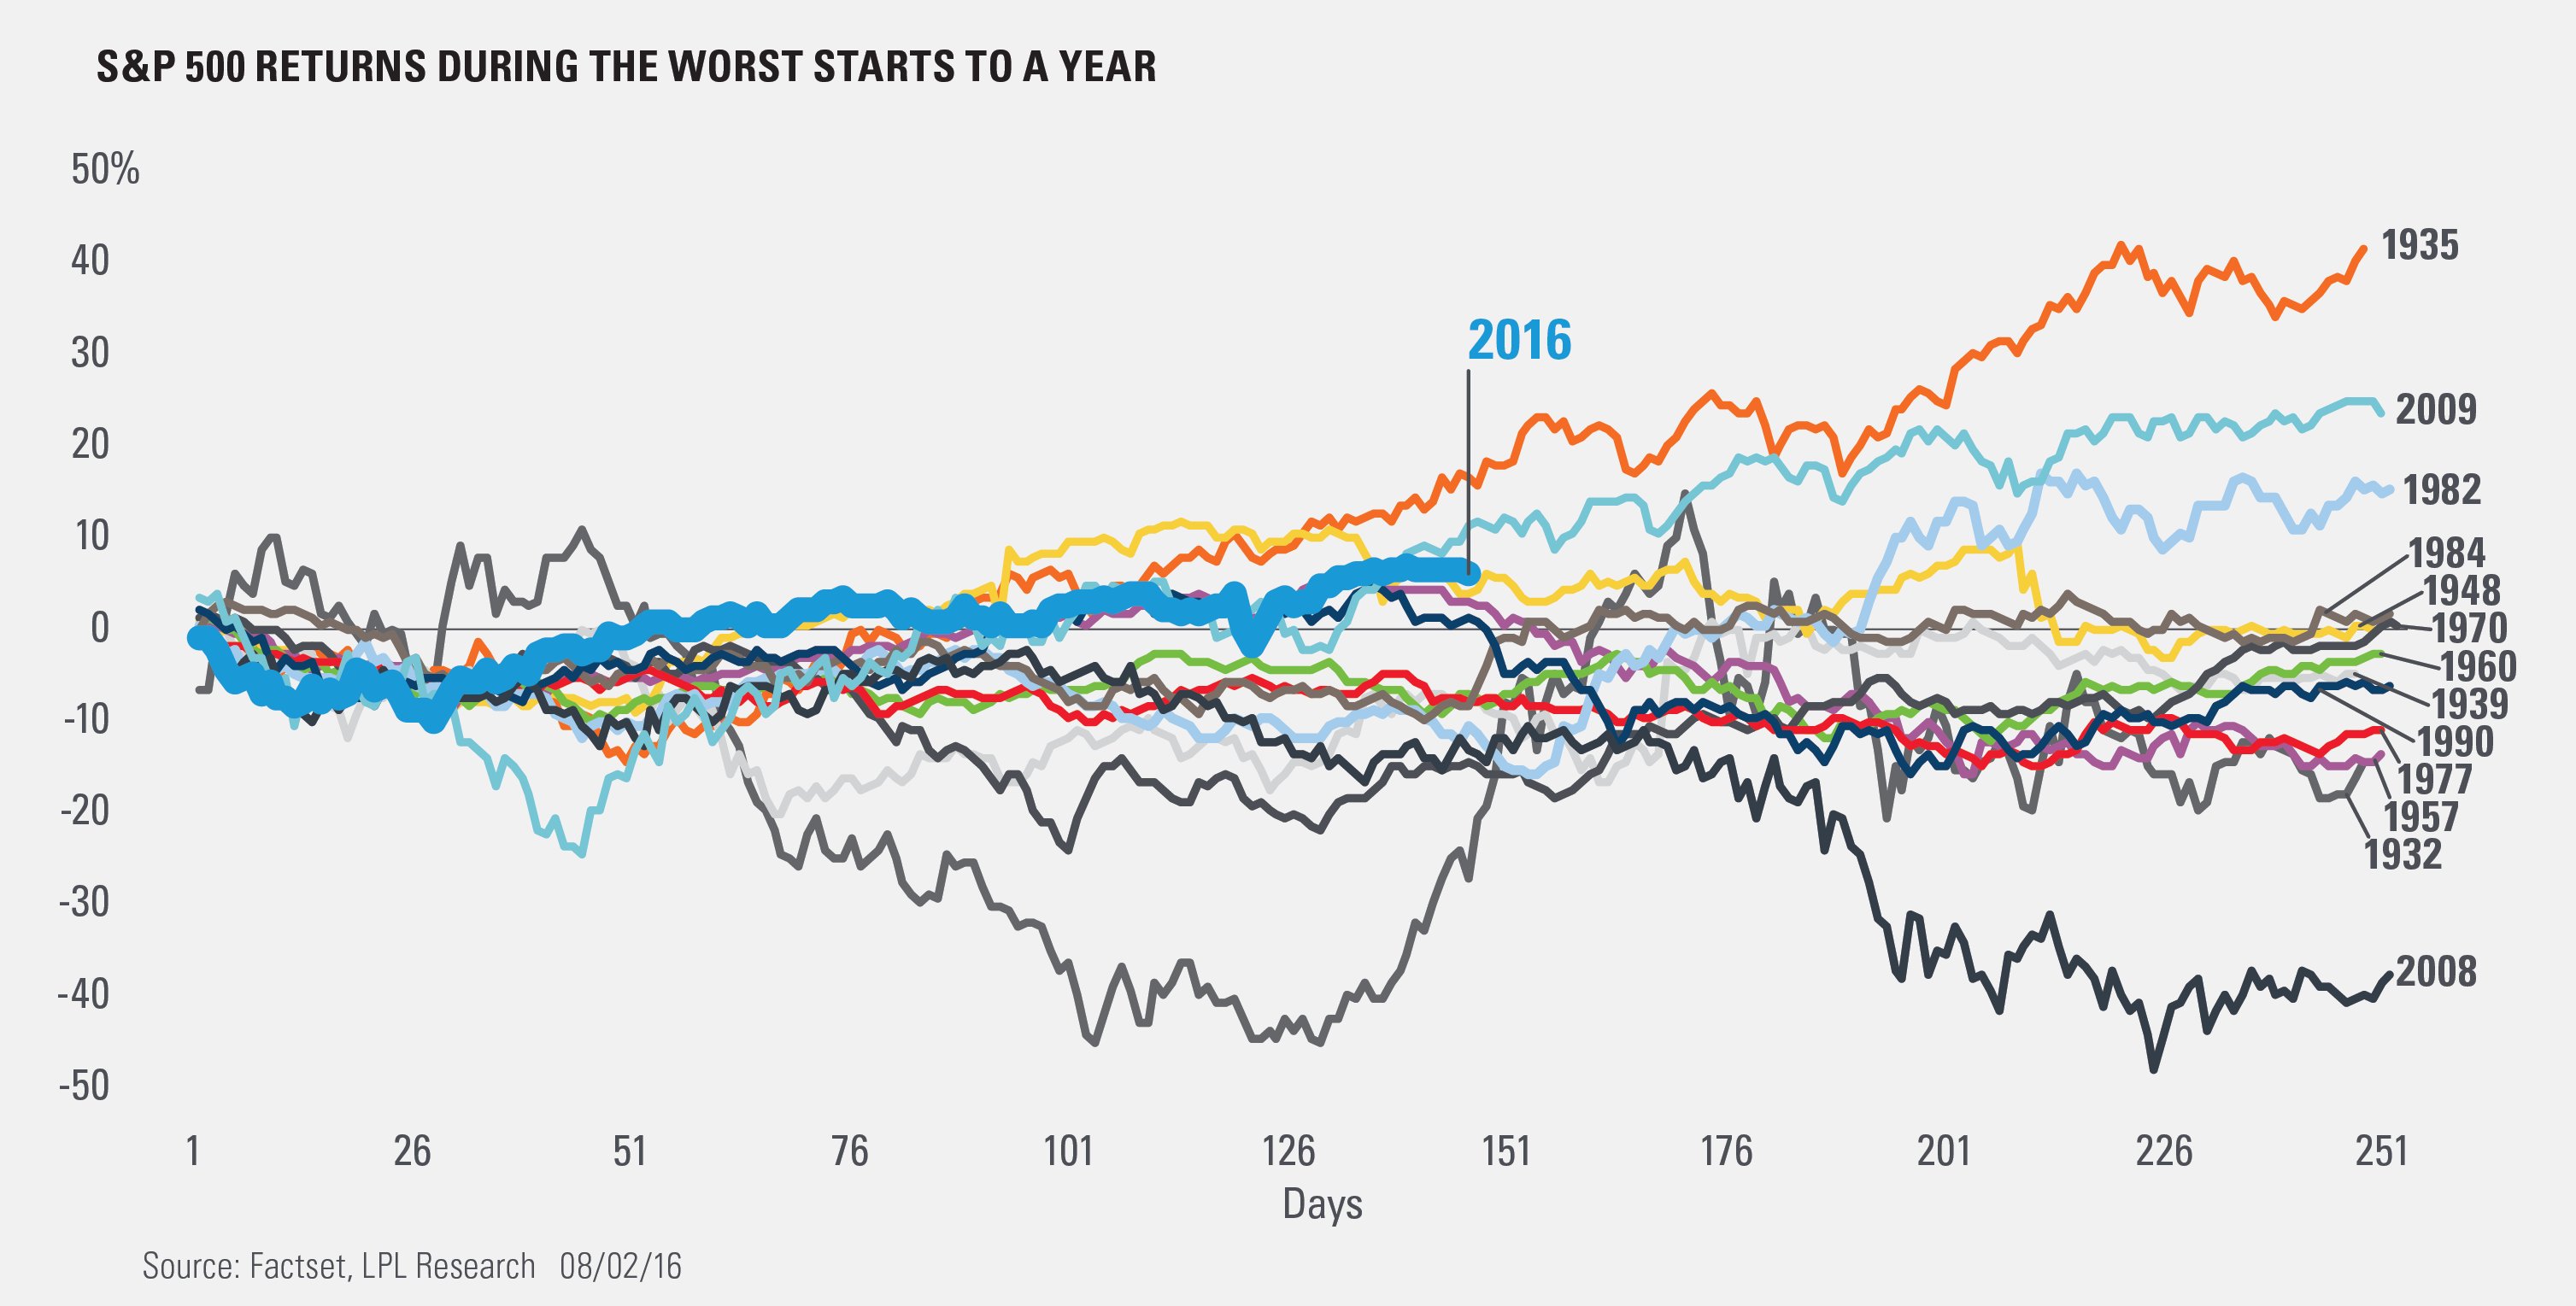
As we noted in our recent Weekly Market Commentary, “Time for an August Swoon?” the levels of risk are rising, as seasonality and optimistic near-term sentiment are growing concerns. But the reversal we’ve seen so far this year bodes well for more potential gains before the year is officially over. We expect that any and all pullbacks may be contained to 5–10% and could potentially be a nice buying opportunity for higher prices later this year.
IMPORTANT DISCLOSURES
Past performance is no guarantee of future results. All indexes are unmanaged and cannot be invested into directly. Unmanaged index returns do not reflect fees, expenses, or sales charges. Index performance is not indicative of the performance of any investment.
The economic forecasts set forth in the presentation may not develop as predicted.
The opinions voiced in this material are for general information only and are not intended to provide or be construed as providing specific investment advice or recommendations for any individual security.
Stock investing involves risk including loss of principal.
The S&P 500 Index is a capitalization-weighted index of 500 stocks designed to measure performance of the broad domestic economy through changes in the aggregate market value of 500 stocks representing all major industries.
This research material has been prepared by LPL Financial LLC.
To the extent you are receiving investment advice from a separately registered independent investment advisor, please note that LPL Financial LLC is not an affiliate of and makes no representation with respect to such entity.
Not FDIC/NCUA Insured | Not Bank/Credit Union Guaranteed | May Lose Value | Not Guaranteed by any Government Agency | Not a Bank/Credit Union Deposit
Securities and Advisory services offered through LPL Financial LLC, a Registered Investment Advisor
Member FINRA/SIPC
Tracking #1-522412 (Exp. 08/17)