
KEY TAKEAWAYS
- The U.S. trade deficit has been a drag on overall GDP growth.
- However, the U.S. continues to steadily grow in its role as an exporter of services.
- In addition, the goods the U.S. does export are generally of higher value.
Click here to download a PDF of this report.
CHECKING IN ON TRADE
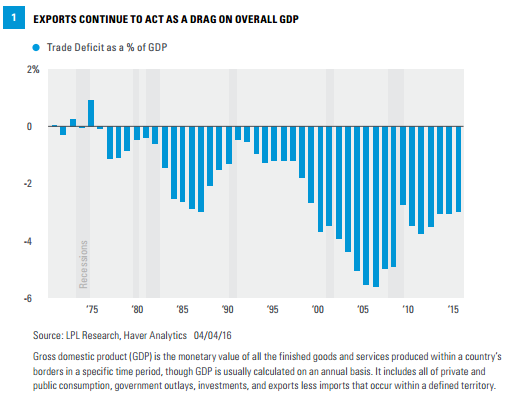
The U.S. has run a trade deficit (importing more goods and services from other countries than it exports) since the mid-1970s, which acts as a drag on overall gross domestic product (GDP) growth [Figure 1]. Although the trade deficit narrows during recessions, when imports typically fall faster than exports, the trade gap has increased over time, and currently stands at around 3.0% of GDP. Along with the massive budget deficit, the trade deficit is one of the major economic challenges facing the U.S. and has fostered the oft-repeated conventional wisdom that “we don’t make anything in the U.S. anymore.” What’s missing from this assessment, however, is the role of the U.S. as a net exporter of services and the increasing value of “good old American know-how.” Here we focus on the details of what we import and export, and the impacts on the U.S. economy.
INSIDE LOOK AT U.S. TRADE DEFICIT
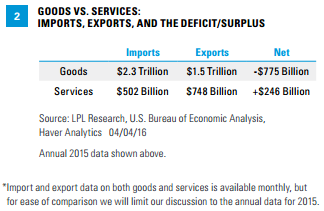
The trade deficit is computed by adding up the value of all goods and services made in the U.S. and shipped to other countries (which adds to GDP), and subtracting the value of all goods and services from abroad purchased in the U.S. (which is subtracted from GDP). Our large deficit on the goods side ($775 billion in 2015*) more than offsets the trade surplus we have on the services side of the ledger ($246 billion in 2015) [Figure 2]. Combined, our goods and services trade deficit was $530 billion in 2015, or 3% of GDP.
The composition of the deficit on the goods side (what we import) contributes to the notion that “we don’t make anything in the U.S. anymore,” while the “hidden” surplus on the service side gets little attention. The United States Bureau of the Census will release the February 2016 data on U.S. imports and exports this week (Tuesday, April 5, 2016), and our trade deficit is likely to get some attention from pundits and politicians, especially during the already contentious election season.
CONSUMER ITEMS DOMINATE U.S. GOODS IMPORTS
In 2015, the U.S. exported $1.5 trillion worth of goods and imported $2.3 trillion, leading to the $775 billion trade deficit on the goods side. The list of our top 10 imported items on the goods side is full of consumer and consumer-related items, such as vehicles ($348 billion), energy ($170 billion), computers and electronic equipment ($120 billion), pharmaceuticals ($108 billion), apparel ($94 billion), furniture ($34 billion), and the somewhat deceiving “miscellaneous manufactured goods” category. This category of imported goods - which includes household items like jewelry, sporting goods, toys and games, office supplies, etc. - is found in the grocery stores and big box discount stores we shop in every day. We imported $115 billion of these goods in 2015 and exported just $45 billion, increasing the trade deficit by $69 billion. Although this category is not the main driver of our overall trade deficit, it is certainly one of the most visible manifestations of it, and contributes to the overall perception that goods aren’t being produced in the U.S. anymore.
GOOD OLD AMERICAN KNOW-HOW DOMINATES OUR SERVICE EXPORTS
What is not as visible to most Americans (and to most pundits and media outlets) is that the U.S. is a net exporter of services, and that our service exports are growing rapidly, as consumers and businesses around the world demand America’s intellectual property, expertise, and culture. In 2015, the U.S. exported $748 billion of services, and imported just $502 billion, for a trade surplus on the services side of $246 billion. Although this is not enough to offset the $775 billion deficit on the goods side, our trade advantage in services is noteworthy. At $748 billion dollars, service exports were at an all-time high in 2015, and have nearly tripled in the past 10 years. This figure towers above our imports in the “miscellaneous manufactured goods” category noted above, and yet it gets very little attention. The U.S. runs large and persistent trade surpluses in many key service areas including
education, intellectual property, travel, insurance, consulting, legal, telecommunications, and financial services - all of which are part of what we like to call “good old American know-how.” In a future edition of the Weekly Economic Commentary, we’ll explore the U.S. advantage in good old American know-how in further detail, and what it means for the economy and for certain segments of the labor market.
In general, the charge that “we don’t make anything in the U.S. anymore” isn’t true; but because many of the items we see and use every day around the house, in the car, or at the office are not made here, it’s easy to draw that conclusion. To say it another way, we see the items we import (and in many cases, previously made here) but don’t regularly see the things that we export; this is either because they are intangible (consulting services, for example) or do not show up in the stores we regularly shop in. When was the last time you saw a giant jet engine or an MRI machine in your local store? Adding to the misperception is that those items we import most tend to be very labor intensive, but generally not very expensive, while those we export are higher valued added. Over time, the U.S. economy - along with most other developed market economies - has made a transition
away from producing low value added, commodities goods toward the production and export of high value added goods (MRI machines and jet engines) and services (legal, consulting, education, intellectual property such as software, etc.). Although this shift has occurred over the past 40 to 50 years, the labor market dislocations of the Great Recession have amplified the impact to many workers in the goods-producing sector.
IMPORTANT DISCLOSURES
The opinions voiced in this material are for general information only and are not intended to provide specific advice or recommendations for any individual. To determine which investment(s) may be appropriate for you, consult your financial advisor prior to investing. All performance reference is historical and is no guarantee of future results. All indexes are unmanaged and cannot be invested into directly.
The economic forecasts set forth in the presentation may not develop as predicted.
This research material has been prepared by LPL Financial LLC.
To the extent you are receiving investment advice from a separately registered independent investment advisor, please note that LPL Financial LLC is not an affiliate of and makes no representation with respect to such entity.
Not FDIC or NCUA/NCUSIF Insured | No Bank or Credit Union Guarantee | May Lose Value | Not Guaranteed by Any Government Agency | Not a Bank/Credit Union Deposit
Tracking #1-484301 (Exp. 04/17)