
KEY TAKEAWAYS
- Several key economic reports are due out this week that will be closely watched for signals on the health of the U.S. and global economy.
- As markets look ahead to the start of fourth quarter 2015 earnings reporting season, the price of oil and its impact on business capital spending and manufacturing remain as key concerns.
- Looking ahead, we expect business capital spending may add to GDP growth, should the roadblocks begin to fade.
Click here to download a PDF of this report.
CAPEX CONUNDRUM
A number of key U.S. and global economic reports are due out this week (January 4-8, 2016), as investors return from the holiday break and refocus on many of the same issues that bedeviled the market in 2015, including the price of oil and the signal it is sending about the health of the global economy. As markets look ahead to the start of fourth quarter 2015 earnings reporting season, which won’t kick into high gear until late January 2016, the price of oil and its impact on business capital spending and manufacturing remain as key concerns.
The reports out this week on the manufacturing sector include:
- Markit Purchasing Managers’ Index (PMI) for manufacturing for December 2015, which was released as this commentary was being published
- Institute of Supply Management’s (ISM) Report on Business Manufacturing Index for December 2015, which was also released as this commentary was being published
- November 2015 factory shipments and orders report
- December 2015 employment report, and specifically the job count in the manufacturing sector
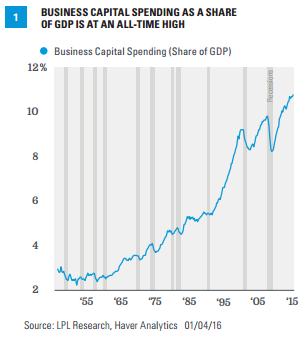
To date, we’ve seen little spillover from the oil-induced weakness in energy-related capital spending into other areas of capital spending; and indeed, business spending as a share of GDP is at an all-time high and in a strong uptrend [Figure 1].
Manufacturing vs. Business Capital Spending
The terms “manufacturing” and “business capital spending” are often used interchangeably by the financial media and pundits, but “manufacturing” and “business capital spending” are not the same, and the definition of business capital spending itself is not uniform. For example, the output of U.S. manufacturers accounts for around 15-20% of U.S. gross domestic product (GDP), around 10% of total employment in the United States, but is a much larger factor in the profits of S&P 500 companies. On the other hand, business capital spending (what businesses small and large spend on equipment, software, intellectual property, and research and development [R&D]) accounts for around 10% of GDP, and adding in what businesses spend on structures–factories, office buildings, malls, oil rigs and gas wells, and other structures–it’s closer to 15%.
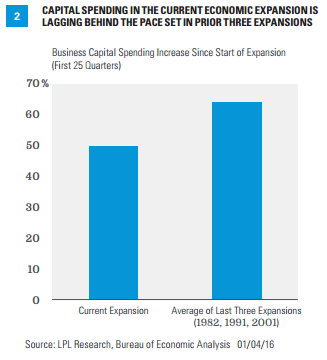
For simplicity, we’ve excluded what businesses spend on structures–office parks, shopping malls, warehouses factories, mining structures and drilling wells–from our analysis, which are sometimes counted as business capital spending; but either with or without structures, the capex (capital expenditure) story is the same. In the first 25 quarters (six years and one quarter) of the current expansion, which began in the second quarter of 2009, business capital spending has increased by 50%, lagging the 64% increase over the same time frame in the past three economic expansions (those beginning in 1982, 1991, and 2001) [Figure 2]. Of the seven major categories of business capital spending, as measured by the National Income and Product Accounts (NIPA), more commonly known as the GDP data, just two (industrial equipment and transportation equipment) are running above the average of the past three recoveries while the other five categories are lagging, and in some cases lagging badly.
Seven Major Categories of Business Capital Spending
- Information processing
- Industrial equipment
- Transportation equipment
- Other equipment
- Software
- Research and development
- Entertainment, literary, and artistic
Notably, until oil prices peaked in mid-2014, the other equipment area of capex–consisting primarily of furniture and fixtures, agricultural machinery, construction machinery, mining and oilfield machinery, service industry machinery, and electrical equipment not elsewhere classified–was running ahead of the pace set in the prior three expansions, but has stalled in the past 18 months as oil prices plunged.
There are several reasons for the lackluster performance of business capital spending relative to recent recoveries, including uncertainty around the economic recovery here and abroad, the pace and magnitude of Federal Reserve (Fed) rate hikes, tax policy uncertainty, and relatively low wage growth at home and abroad (making it easier and more profitable to add additional labor rather than invest in a new machine). The lack of capex is even more puzzling when you take into account that corporations’ interest costs are near an all-time low, banks are making loans readily available for businesses to expand, and the average age of plants and equipment in the U.S. is the oldest in more than 50 years [Figure 3].

As 2015 ends and 2016 begins, several of these roadblocks are in the process of going away. The Fed has raised rates once and intends to raise rates another four times this year, lessening that ambiguity. Wages appear to have bottomed out and accelerated throughout 2015. The December 2015 reading on wage inflation is due out on Friday, January 8, 2016, along with the December 2015 employment report. With wages–and healthcare costs–rising, it becomes more attractive to invest in new equipment or productivity-enhancing software instead of hiring new employees. Questions around the economic recovery and business cycle remains, although the commentary surrounding it has shifted recently from, “We’re still in recession so we can’t commit to any capex,” to, “The recovery is out of steam and next recession is right around the corner so I can’t invest now.” The uncertainty around taxes has lifted a bit recently, as the year-end tax package passed by Congress and signed by President Obama makes permanent the R&D tax credit, which should help to boost capex, but taxes and regulation remain as top concerns for small businesses as we enter 2016.
Looking ahead, in the fourth quarter of 2015 we expect business capital spending may add to GDP growth, as it consistently has since early 2010, and over the course of 2016 as well, should the roadblocks to capex fade and the average age of the capital stock in the U.S. economy continue to increase.
IMPORTANT DISCLOSURES
The opinions voiced in this material are for general information only and are not intended to provide specific advice or recommendations for any individual. To determine which investment(s) may be appropriate for you, consult your financial advisor prior to investing. All performance referenced is historical and is no guarantee of future results. Any economic forecasts set forth in the presentation may not develop as predicted and there can be no guarantee that strategies promoted will be successful.
The economic forecasts set forth in the presentation may not develop as predicted.
Gross domestic product (GDP) is the monetary value of all the finished goods and services produced within a country’s borders in a specific time period, though GDP is usually calculated on an annual basis. It includes all of private and public consumption, government outlays, investments, and exports less imports that occur within a defined territory.
This research material has been prepared by LPL Financial.
To the extent you are receiving investment advice from a separately registered independent investment advisor, please note that LPL Financial is not an affiliate of and makes no representation with respect to such entity.
Not FDIC or NCUA/NCUSIF Insured | No Bank or Credit Union Guarantee | May Lose Value | Not Guaranteed by Any Government Agency | Not a Bank/Credit Union Deposit
Tracking #1-452970 (Exp. 01/17)