For the first time in history, the S&P 500 moved on Friday from within a 0.5% of a new high one day (Thursday) to a new two-month low the next day (Friday). The 2.5% drop was the first move greater than 1% (up or down) in 43 days and the first 1% decline in 51 days. To put it in perspective, it was the largest daily drop since the Brexit vote and the third largest drop of the calendar year. Lastly, it was only the second time all year the S&P 500 closed exactly at the intra-day low (with May 11 the other day).
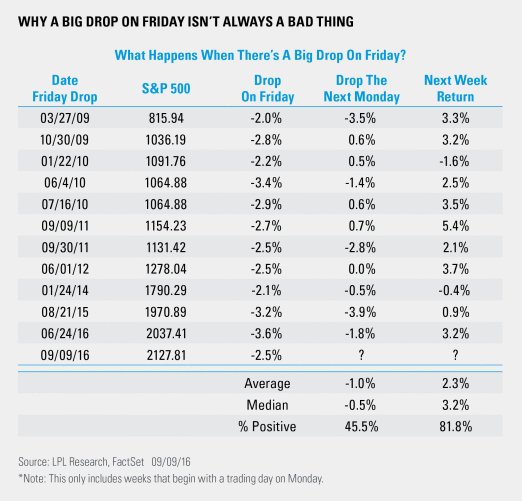
What does a big drop on a Friday mean? Well, the previous two times the S&P 500 dropped more than 2% on a Friday and the next trading day was a Monday, the return on Monday was down 3.9% (August 2015) and down 1.8% (Monday after the Brexit vote). In other words, we’ve seen some follow-through on this Friday weakness so far.
Taking it out further, there have been 11 other times the S&P 500 dropped more than 2% on a Friday, and the next trading day was a Monday, and there has definitely been additional weakness, with an average drop of 1% on those Mondays. The good news? The return the following week has been higher 9 of 11 times. In fact, as the chart below shows, some of the largest drops on Monday actually led to some of the largest bounces that week.
The drop on Friday shook up many investors; however, based on what history says about near-term performance, maybe there isn’t much reason to worry.
IMPORTANT DISCLOSURES
Past performance is no guarantee of future results. All indexes are unmanaged and cannot be invested into directly.
The opinions voiced in this material are for general information only and are not intended to provide or be construed as providing specific investment advice or recommendations for any individual security.
The economic forecasts set forth in the presentation may not develop as predicted.
Investing in stock includes numerous specific risks including: the fluctuation of dividend, loss of principal and potential illiquidity of the investment in a falling market.
The S&P 500 Index is a capitalization-weighted index of 500 stocks designed to measure performance of the broad domestic economy through changes in the aggregate market value of 500 stocks representing all major industries.
This research material has been prepared by LPL Financial LLC.
To the extent you are receiving investment advice from a separately registered independent investment advisor, please note that LPL Financial LLC is not an affiliate of and makes no representation with respect to such entity.
Not FDIC/NCUA Insured | Not Bank/Credit Union Guaranteed | May Lose Value | Not Guaranteed by any Government Agency | Not a Bank/Credit Union Deposit
Securities and Advisory services offered through LPL Financial LLC, a Registered Investment Advisor Member FINRA/SIPC
Tracking #1-534443 (Exp. 09/17)