
The S&P 500 first closed above the 2,000 level for the first time ever in August 2014. With that event came a lot of excitement, as the bull market was running strong. Incredibly, since then, the S&P 500 has traded in a historically tight range—frustrating both bulls and bears alike. In fact, over the past 22 months the S&P 500 has traded in a range of just 17.9%, one of only five times it has traded in a range of less than 20% over a period of 22 months.
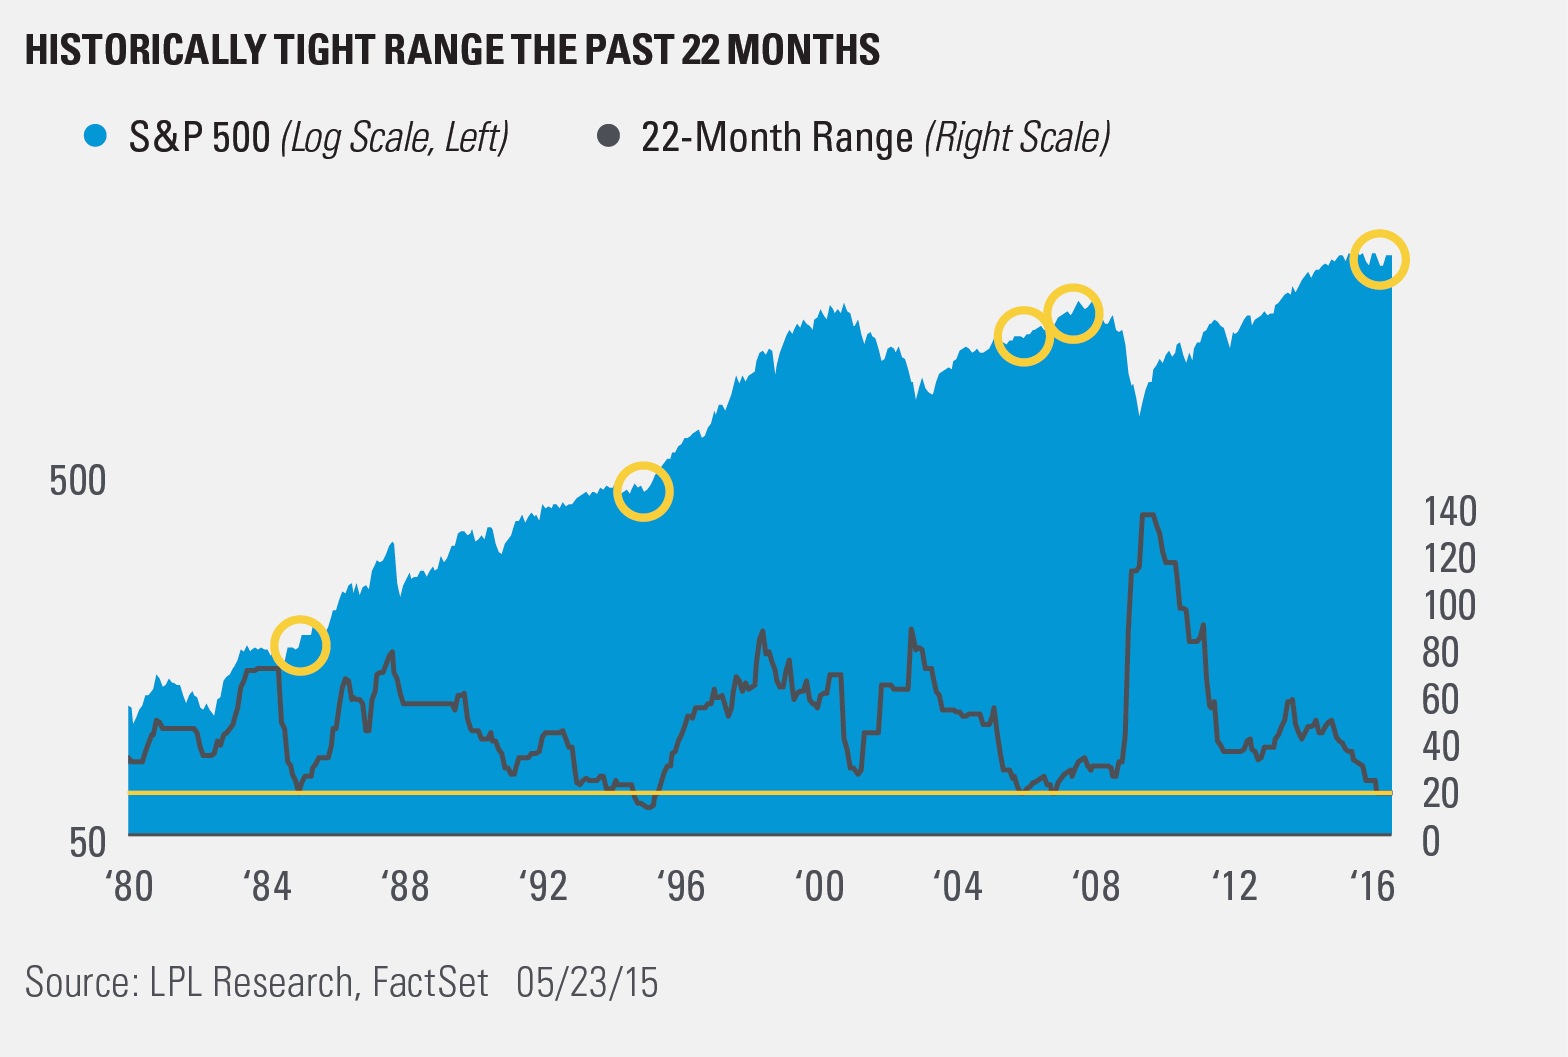
Looking at the chart above, 2005 and 2006 were the last times to see a range this tight. Of course, that was nearing the end of that bull market, but the two times before were the mid-1990s and late 1984. Both of those occurrences were simply a break in multiyear bull markets. What could this time be? Be sure to read our Weekly Market Commentary, due out later today, which takes a closer look at this very question. On a side note, it is interesting that near the middle of each decade these tight ranges appear to happen.
Does it feel like things have been flat for 22 months? Odds are, no, as there have been two 10% corrections since August 2015, followed by quick bounces higher. Not to mention, 2016 saw the worst start to a year ever for the S&P 500 after 28 days, followed up with a big bounce back to break even, all during the first quarter.
This is why it pays to take a broader look at what is really happening, as the daily news and volatility can put a much different spin on things. We continue to expect a volatile second half of the year and mid-single-digit gains for equities when all is said and done in 2016.* If history has taught us anything, it is that tight ranges lead to more volatile ranges, which does suggest good odds of more volatility ahead.
IMPORTANT DISCLOSURES
*Historically since WWII, the average annual gain on stocks has been 7-9%. Thus, our forecast is roughly in-line with average stock market growth. We forecast a mid-single digit gain, including dividends, for U.S. stocks in 2016 as measured by the S&P 500. This gain is derived from earnings per share (EPS) for S&P 500 companies assuming mid-to-high-single-digit earnings gains, and a largely stable price-to-earnings ratio. Earnings gains are supported by our expectation of improved global economic growth and stable profit margins in 2016.
Past performance is no guarantee of future results. All indexes are unmanaged and cannot be invested into directly. Unmanaged index returns do not reflect fees, expenses, or sales charges. Index performance is not indicative of the performance of any investment.
The economic forecasts set forth in the presentation may not develop as predicted.
The opinions voiced in this material are for general information only and are not intended to provide or be construed as providing specific investment advice or recommendations for any individual security.
Stock investing involves risk including loss of principal.
The S&P 500 Index is a capitalization-weighted index of 500 stocks designed to measure performance of the broad domestic economy through changes in the aggregate market value of 500 stocks representing all major industries.
This research material has been prepared by LPL Financial LLC.
To the extent you are receiving investment advice from a separately registered independent investment advisor, please note that LPL Financial LLC is not an affiliate of and makes no representation with respect to such entity.
Not FDIC/NCUA Insured | Not Bank/Credit Union Guaranteed | May Lose Value | Not Guaranteed by any Government Agency | Not a Bank/Credit Union Deposit
Securities and Advisory services offered through LPL Financial LLC, a Registered Investment Advisor
Member FINRA/SIPC
Tracking #1-5000111 (Exp. 05/17)