
Investors have been especially patient during the S&P 500 Index’s 93-day drought of record highs, especially considering the gauge has posted a new high every 12 days on average in this bull market.
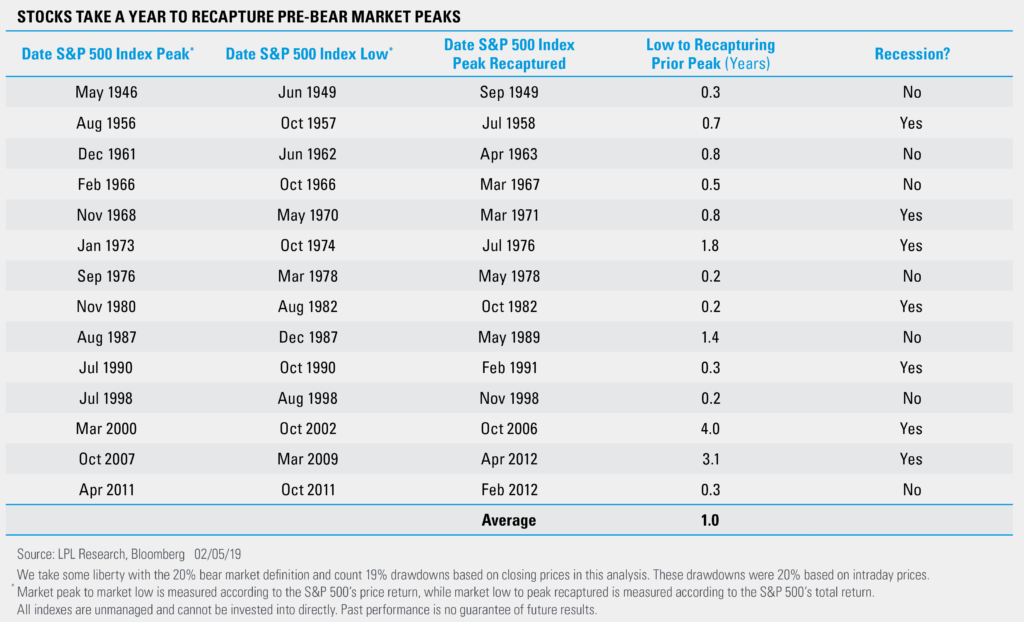
However, history shows the S&P 500 typically takes some time to bounce back after swift drawdowns, like the 20% intraday slide investors experienced late in 2018. As shown in the LPL Chart of the Day, U.S. stocks have taken an average of a year to recover from intraday bear markets over the last 60 years.
To be fair, stocks have recovered quickly this year, bolstered by heavily oversold conditions at the bottom of the selloff. It’s been about a month and a half since the S&P 500 bottomed on December 24, 2018, and the index is already about 7% from its September peak. The S&P 500’s 7.9% gain last month was its best for a January in over 30 years, and the benchmark could cap its sixth straight daily gain today.
Solid economic growth and flexible monetary policy have also aided in stocks’ recent recovery, and we believe improving fundamentals could carry the S&P 500 higher. On average, the S&P 500 has taken about 6 months to reach a new peak after a non-recessionary bear market, compared to 1.6 years (about 19 months) to recapture the peak when the U.S. economy is in a recession. While global risk could hinder stocks’ next leg up, we expect to see a trade resolution and stability in the near term.
“We encourage investors to be patient with U.S. stocks, as we expect the S&P 500 to reach new highs this year,” said LPL Research Chief Investment Strategist John Lynch. “Volatility could persist as the economic cycle ages and global headwinds persist, but we believe stocks can find further support from steady economic growth and higher corporate profits as the impacts of fiscal stimulus continue to flow through.”
As mentioned in our Outlook 2019, we forecast that the S&P 500 will end 2019 at 3,000.
IMPORTANT DISCLOSURES
The opinions voiced in this material are for general information only and are not intended to provide specific advice or recommendations for any individual security. To determine which investment(s) may be appropriate for you, consult your financial advisor prior to investing. The economic forecasts set forth in this material may not develop as predicted.
All indexes are unmanaged and cannot be invested into directly. Unmanaged index returns do not reflect fees, expenses, or sales charges. Index performance is not indicative of the performance of any investment. All performance referenced is historical and is no guarantee of future results.
Investing involves risks including possible loss of principal. No investment strategy or risk management technique can guarantee return or eliminate risk in all market environments.
This research material has been prepared by LPL Financial LLC.
To the extent you are receiving investment advice from a separately registered independent investment advisor, please note that LPL Financial LLC is not an affiliate of and makes no representation with respect to such entity.
The investment products sold through LPL Financial are not insured deposits and are not FDIC/NCUA insured. These products are not Bank/Credit Union obligations and are not endorsed, recommended or guaranteed by any Bank/Credit Union or any government agency. The value of the investment may fluctuate, the return on the investment is not guaranteed, and loss of principal is possible.
For Public Use | Tracking # 1-819597 (Exp. 02/20)