
Last Friday many of people started their weekend early and probably missed our blog post. Today we want to take another look at that post, and also at investor sentiment.
First, Friday’s blog showed that when adjusted for inflation, the S&P 500 hasn’t made a new all-time high for more than 16 years. That right there got people’s attention, but it intentionally didn’t include a key component to long-term gains—dividends. Adding in dividends pushes the current level of the S&P 500 to more than 35% above the March 2000 peak.
Here’s where things get very interesting. We shared both charts on Twitter. Take one guess which chart got significantly more attention? The one that sounded more bearish, indicating no new high has been made for 16 years.
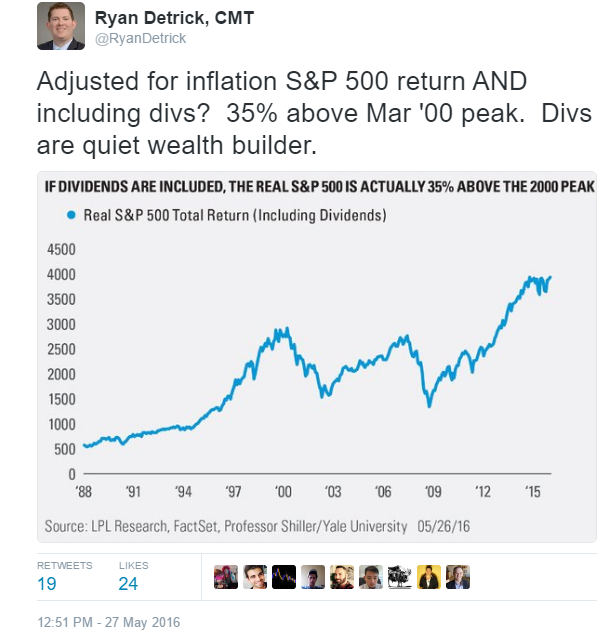
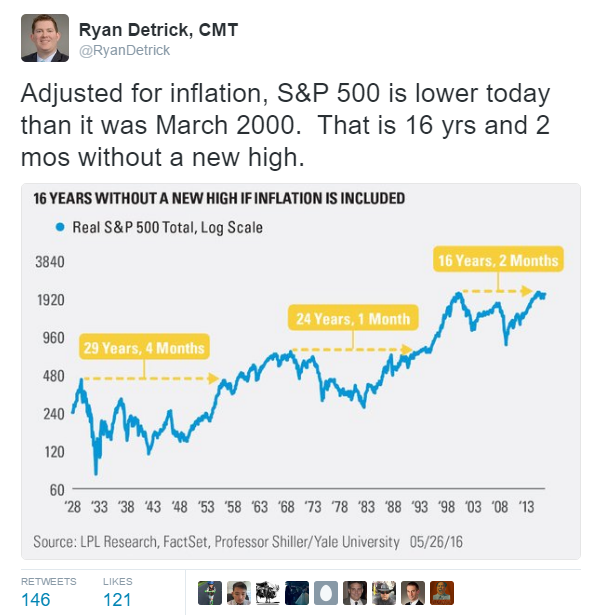
There were 146 retweets for the bearish chart versus 19 retweets for the more practical and bullish chart. This sums up the mindset of many, as attention continues to be paid to the reasons to worry—nearly ignoring the positives. Two things to consider: 1) the S&P 500 is 1.5% away from a new all-time high; and 2) on a total return basis (including dividends), the S&P 500 is set to close at a new monthly high in May. The lack of excitement over this is quite surprising.
As another example, Barron’s had a great cover story talking about why stocks still had room to run, but it was titled the less than enthusiastic “5 Reasons the Stock Market Won’t Crash – Yet.” We couldn’t tell you the last time someone asked a bullish question at a conference, as the questions are dominated with what could go wrong versus what could go right.
Turning to other areas of sentiment, last week, the American Association of Individual Investors (AAII) sentiment poll had less than 18% of those polled vote they were bullish, the lowest since 2005. For comparison, the week of the March 2009 lows saw the bulls came in at 19%. Of course, the S&P 500 was 54% away from new highs back then versus less than 2% currently. We view sentiment like this as: If nearly everyone is bullish, there probably isn’t anyone left to buy; and if everyone is bearish, most of those that want to sell have already sold. In other words, this is a contrarian indicator.
Given the S&P 500 has traded in a historically tight range the past 22 months, bulls and bears alike are rather frustrated at this point, as more than 50% of those polled voted in the neutral camp—something that has happened only two other times the past 20 years. The chart below includes a further look back, showing the handful of times we’ve seen the bulls beneath 25%, neutral above 50%, and bears above 25%.
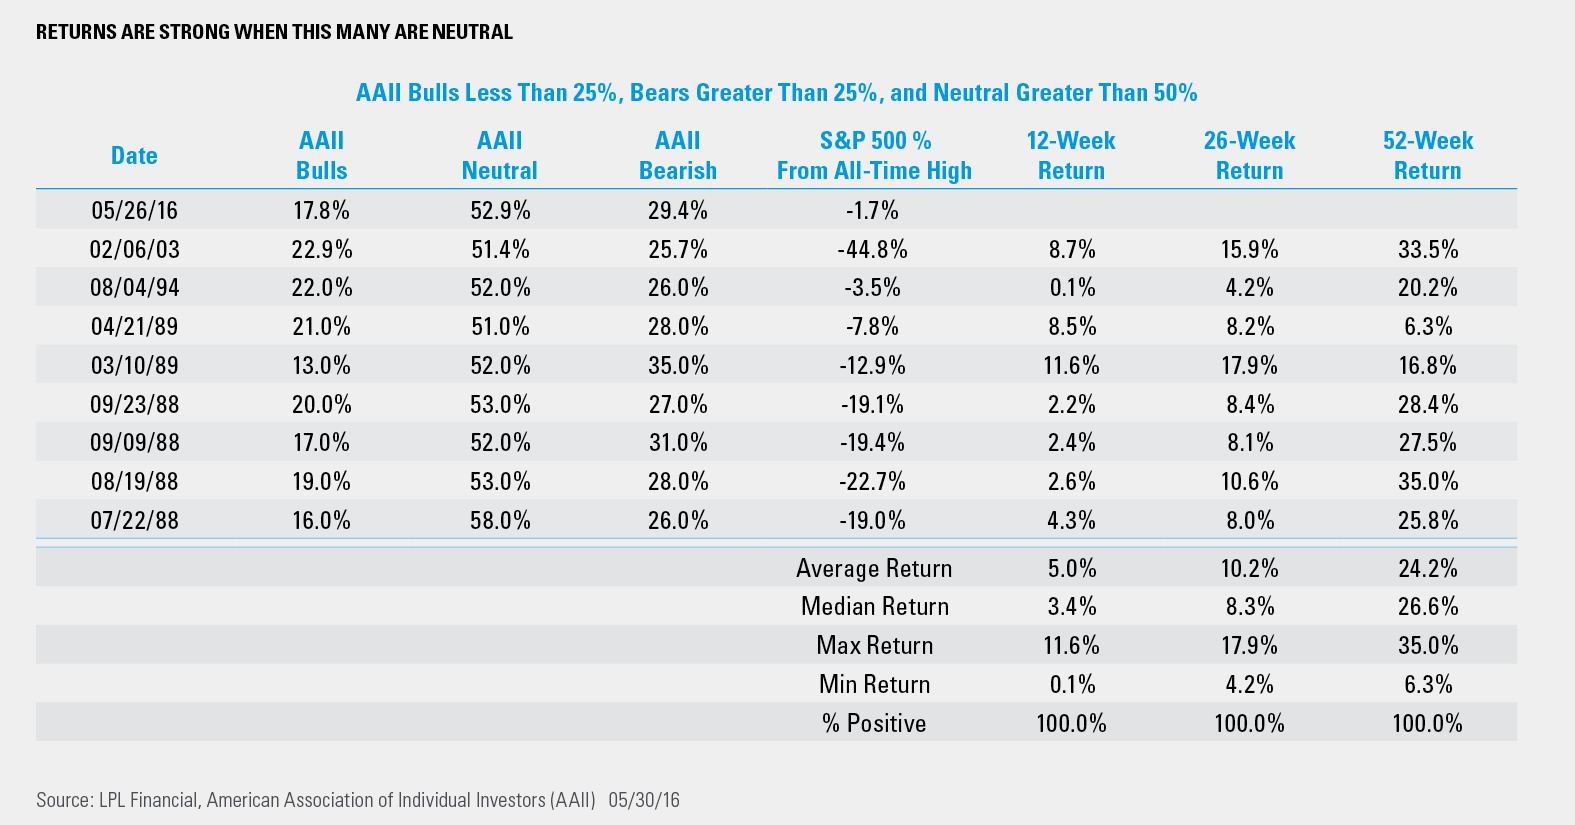
Overall, there are rather strong returns when the sentiment backdrop looks like it does now. Remember though, sentiment is only one part to the investing puzzle, as we also include fundamentals, valuations, and technicals. No doubt we would rank the overwhelming lack of excitement as a major plus from a contrarian point of view, but areas like fundamentals and valuations still are concerning in some aspects. Overall, we continue to think new highs will come this year and expect mid-single-digit gains for equities.* One of the potential biggest drivers to those gains could be the negative sentiment backdrop.
IMPORTANT DISCLOSURES
*Historically since WWII, the average annual gain on stocks has been 7-9%. Thus, our forecast is roughly in-line with average stock market growth. We forecast a mid-single digit gain, including dividends, for U.S. stocks in 2016 as measured by the S&P 500. This gain is derived from earnings per share (EPS) for S&P 500 companies assuming mid-to-high-single-digit earnings gains, and a largely stable price-to-earnings ratio. Earnings gains are supported by our expectation of improved global economic growth and stable profit margins in 2016.
Past performance is no guarantee of future results. All indexes are unmanaged and cannot be invested into directly. Unmanaged index returns do not reflect fees, expenses, or sales charges. Index performance is not indicative of the performance of any investment.
The economic forecasts set forth in the presentation may not develop as predicted.
The opinions voiced in this material are for general information only and are not intended to provide or be construed as providing specific investment advice or recommendations for any individual security.
Stock investing involves risk including loss of principal.
The S&P 500 Index is a capitalization-weighted index of 500 stocks designed to measure performance of the broad domestic economy through changes in the aggregate market value of 500 stocks representing all major industries.
The AAII Investor Sentiment Survey measures the percentage of individual investors who are bullish, bearish, and neutral on the stock market for the next six months; individuals are polled from the ranks of the AAII membership on a weekly basis. Only one vote per member is accepted in each weekly voting period. For more information, go to: http://www.aaii.com/sentimentsurvey.
This research material has been prepared by LPL Financial LLC.
To the extent you are receiving investment advice from a separately registered independent investment advisor, please note that LPL Financial LLC is not an affiliate of and makes no representation with respect to such entity.
Not FDIC/NCUA Insured | Not Bank/Credit Union Guaranteed | May Lose Value | Not Guaranteed by any Government Agency | Not a Bank/Credit Union Deposit
Securities and Advisory services offered through LPL Financial LLC, a Registered Investment Advisor
Member FINRA/SIPC
Tracking #1-502163 (Exp. 05/17)