
Treasury yields have been historically quiet this year.
As shown in the LPL Chart of the Day, the 10-year Treasury yield has bounced around in a 23-basis point (bps) (.23%) range year to date, the second-smallest range at this point in the year since 1974.
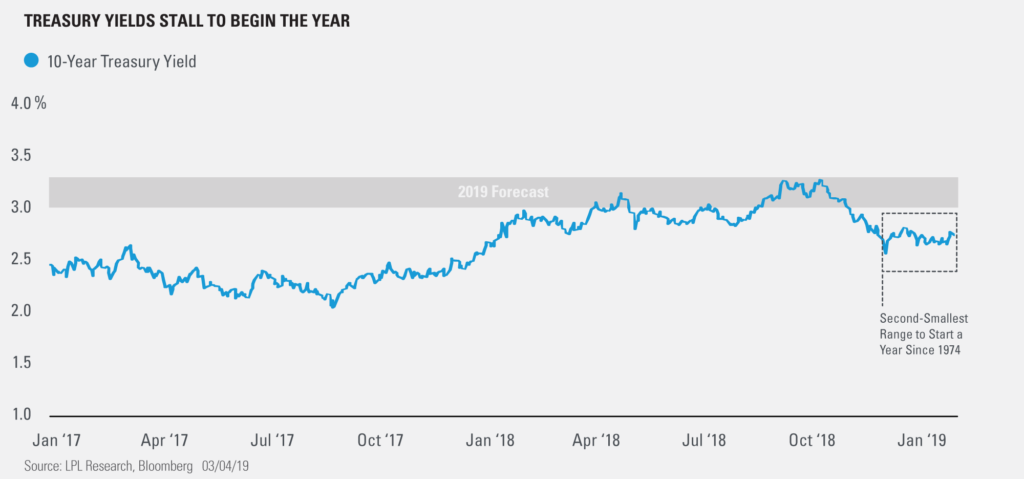
It may be difficult to imagine a breakout in either direction, but expect the 10-year yield to end 2019 between 3% and 3.25%, or about 30 to 50 bps (.30-.50%) higher than where the benchmark yield is trading now.
“Long-term rates have stalled as
The 10-year Treasury yields could climb from current levels due to:
- Healthy inflation. Short- and long-term breakeven rates, or the difference between yields of nominal Treasuries and Treasury-Inflation Protected Securities (TIPS), have posted strong rallies to kick off the year, but yields have barely responded. We expect yields to eventually climb as growth stabilizes and inflation remains at healthy levels.
- International demand. Treasury yields are attractive compared to other sovereign debt, and evidence of a global slowdown has increased demand for safe assets. While international demand will likely keep a cap on yields long-term, we think part of this demand will wane as trade risk subsides, weighing on prices and supporting yields.
- Positioning. Institutional investors are speculating on lower prices (and higher yields) at a historic pace. Large speculators in 10-year Treasury futures have increased net short positioning for four straight weeks, the longest streak since October 2017.
- Momentum. Historically, yields haven’t stayed this quiet for long. On February 20, the MOVE Index, a measure of implied (and actual) volatility in Treasury options, fell to 44.5, the second-lowest level on record. Since 1990, when the MOVE Index has fallen below 50, the 10-year yield has risen 9 bps (.09%) over the following month (relative to an average one-month change of -2 bps or -.02%).
For more of our thoughts on fixed income, check out our Outlook 2019.
IMPORTANT DISCLOSURES
The opinions voiced in this material are for general information only and are not intended to provide specific advice or recommendations for any individual security. To determine which investment(s) may be appropriate for you, consult your financial advisor prior to investing. The economic forecasts set forth in this material may not develop as predicted.
All indexes are unmanaged and cannot be invested into directly. Unmanaged index returns do not reflect fees, expenses, or sales charges. Index performance is not indicative of the performance of any investment. All performance referenced is historical and is no guarantee of future results.
Investing involves risks including possible loss of principal. No investment strategy or risk management technique can guarantee return or eliminate risk in all market environments.
This research material has been prepared by LPL Financial LLC.
To the extent you are receiving investment advice from a separately registered independent investment advisor, please note that LPL Financial LLC is not an affiliate of and makes no representation with respect to such entity.
The investment products sold through LPL Financial are not insured deposits and are not FDIC/NCUA insured. These products are not Bank/Credit Union obligations and are not endorsed, recommended or guaranteed by any Bank/Credit Union or any government agency. The value of the investment may fluctuate, the return on the investment is not guaranteed, and loss of principal is possible.
For Public Use | Tracking # 1-828699 (Exp. 03/20)