
STRONG WEEK AHEAD OF BIG WEEKEND
John Lynch Chief Investment Strategist, LPL Financial
Jeffrey Buchbinder CFA Equity Strategist, LPL Financial
KEY TAKEAWAYS
- Last week’s stock market rally was driven by optimism (now clearly warranted) surrounding U.S.-China trade talks and a more dovish Fed.
- The events added to the positive fundamental case for stocks here, while stock valuations are quite reasonable.
- The technical picture is muddled, but big gains to start this week—should they hold—would help increase the odds of further gains from a technical analysis perspective.
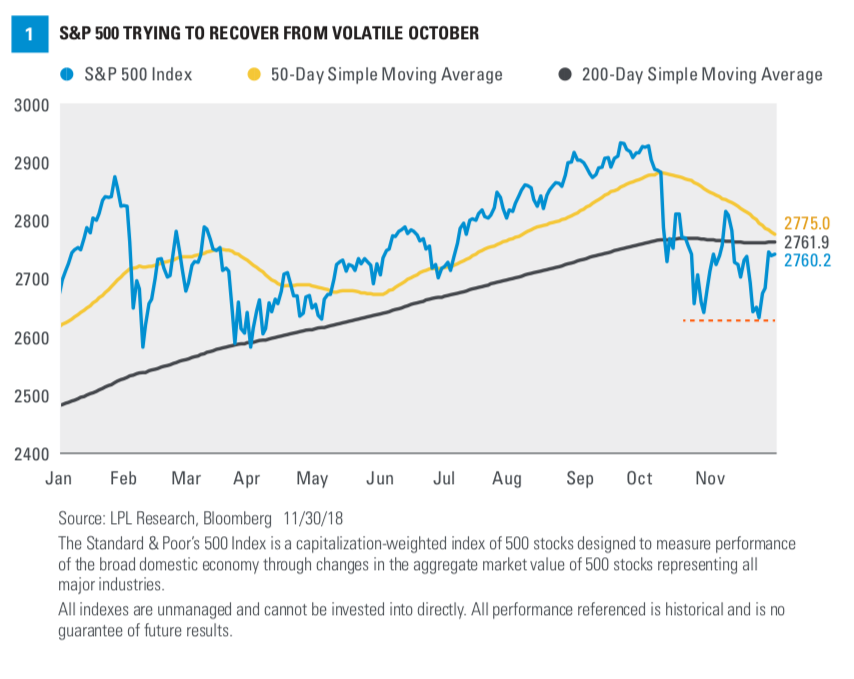
It was a great week for the stock market. The S&P 500 Index rallied 4.9% last week, leaving the index less than 6% from its record high, on September 20, 2018 (excluding today’s gains) [Figure 1]. Gains were driven by increasing optimism (now proven to be warranted) for progress on U.S.-China trade talks at the G20 summit over the weekend and a more dovish outlook from Federal Reserve Chair Jay Powell (see today’s Weekly Economic Commentary for more). This week we share our thoughts on these major market-moving events and reiterate our positive stock market outlook.
TRADE TRUCE
The market is focused primarily on two things right now: trade and the Federal Reserve (Fed). On trade, as we expected, the meeting between President Trump and Chinese President Xi at the G20 summit yielded positive results. The two powers agreed to a 90-day halt on fresh tariffs
and increases in tariff rates, while they intensify negotiations. In addition, China agreed to purchase a “substantial” amount of U.S. agricultural and industrial goods to help narrow the trade deficit and, according to President Trump, will reduce or eliminate tariffs on imported American-made cars. Based on the immediate stock market reaction, it’s clear that the outcome landed at the high end of the market’s expectations.
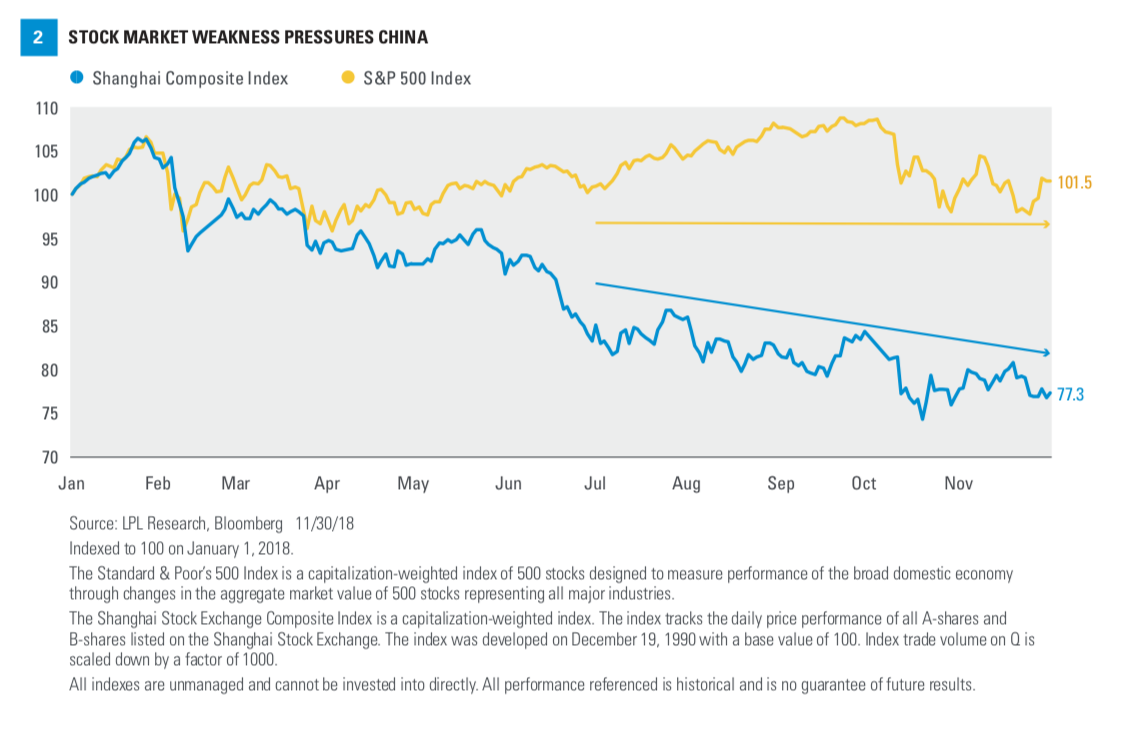
Although this is progress, we’re not out of the woods. Future talks may stall, leading to higher and more tariffs. It will be difficult to reach an agreement on forced transfers of U.S. technology to Chinese companies and enforcement of intellectual property theft. But given how much both sides have to lose, we continue to expect an agreement early next year. Weakness in the Chinese stock market has added to the economic pressure China is under to strike a deal [Figure 2].
FED EASES CONCERNS
Powell certainly eased the other primary concern for markets last week with his more dovish rate- hike outlook during a speech on Wednesday (November 28). The Dow Jones Industrial Average’s surge that day underscored the market angst around how far from the neutral rate the Fed’s target interest rate might be. The Dow’s 600-point climb on Wednesday is a testament to how much impact Powell’s word choices—“a long way from neutral” to “just below neutral”—can have. We are encouraged by the flexibility suggested by Powell’s latest comments. The risk that the Fed disrupts markets down the road still exists, but this clarification represents progress toward interest rate and currency stability, which is positive for stocks.
SOLID FUNDAMENTALS
Amid the flurry of trade headlines over the weekend, we wanted to reiterate our view that stock market fundamentals remain positive.
First, the U.S. economy remains in excellent shape. Gross domestic product (GDP) grew at a very strong pace over the past two quarters, near 4%, and is expected to grow at a nearly 3% pace in the coming year, despite some drag from exports due to the ongoing trade dispute. Consumers and businesses remain quite confident. The job market is healthy, bolstering already healthy consumer finances.
Our favorite leading indicators point to continued economic growth in the year ahead. We expect fiscal stimulus to offset the impact of tariffs.
Corporate profits also provide fundamental support. S&P 500 Index earnings grew more than 28% year over year in the third quarter as results solidly outpaced expectations, supported by better economic growth, robust manufacturing activity, and tax cuts. Companies generally provided upbeat guidance. Wage pressures may cap profit margin expansion, but we think the macroeconomic outlook is strong enough to support potential high-single-digit earnings growth for the S&P 500 in 2019 even if some tariffs remain in place.
Though stock market volatility has been elevated since the September highs, keep in mind we are in a historically positive seasonal period that may help us finish the year strong. Not only has the fourth quarter historically been the best, especially in midterm election years (despite the S&P 500 being down 5% so far this quarter), but December has historically been one of the best of the 12 months. In fact, December is the only month that has never been the worst of the year for the S&P 500. Finally, remember that since 1946, the S&P 500 has never been down over the 12 months following midterm elections (18 for 18).
ATTRACTIVE VALUATIONS
The latest pullback in the S&P 500, which has been accompanied by rising earnings, leaves the S&P 500 price-to-earnings ratio (PE) at just 15.7 times, based on the next 12 months’ earnings estimates. At that level, stocks are cheaper than the post-1980 average, near 17 (FactSet data). When factoring
in low interest rates (the 10-year Treasury yield is historically low at around 3.0%) and still-low inflation (the Fed’s preferred inflation measure came in at 1.8% in October, below the central bank’s 2% target), we would argue valuations are attractive even if earnings next year fall a bit short of estimates, as is usually the case. Consensus estimates from FactSet are calling for a roughly 9% increase in S&P 500 earnings in 2019, which we think is achievable depending on how the tariff situation plays out.
TECHNICAL TAKE
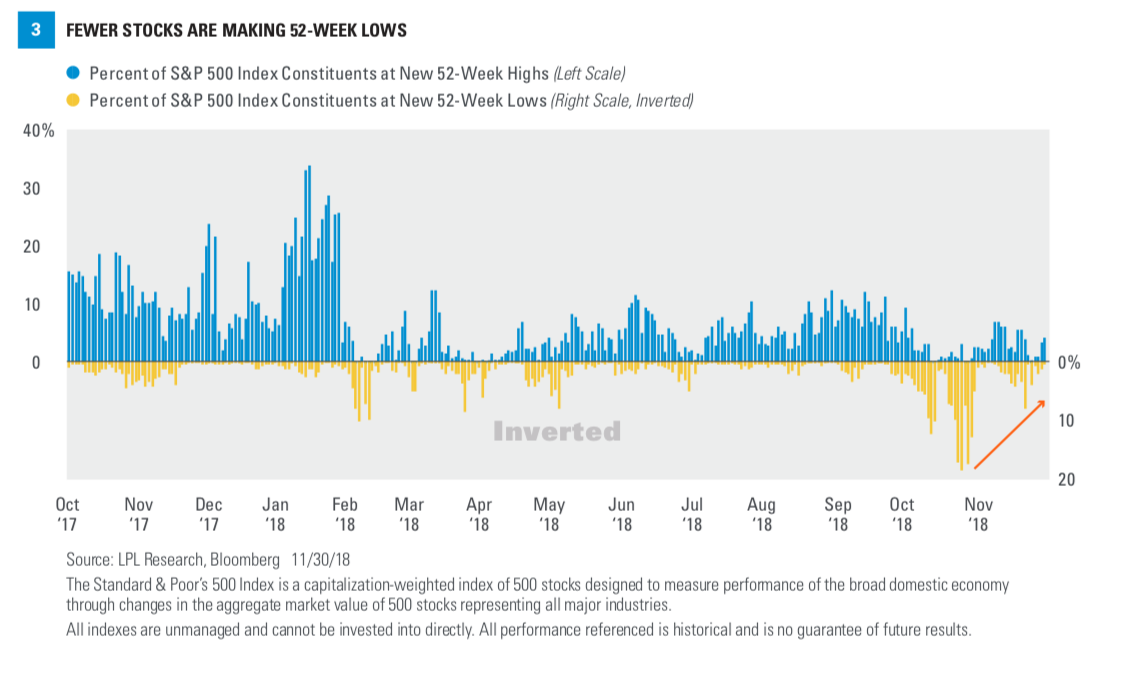
On a technical basis, the S&P 500 remains relatively range-bound, with overhead resistance near the 2814 level, and strong support near 2630. While the flat 200-day moving average suggests a general lack of trend in the market, it’s important to remember that bottoming is a process. Two strong points for the bulls: Not only did we hold the October lows in recent weeks, but fewer stocks made 52-week lows in November than in October [Figure 3]. In other words, we are seeing more strength under the surface than the broad index might suggest. Second, November 28 registered one of the highest breadth readings of the year, with advancers outnumbering decliners 7:1. This kind of strong buying interest will be necessary to push stocks to new highs.
CONCLUSION
The events over the past week added to the positive fundamental case for stocks here. A potentially more gradual pace of rate hikes by the Fed and a truce in the U.S.-China trade dispute helped ease the market’s two biggest concerns. The U.S. economy is doing quite well, earnings are growing nicely, valuations are quite reasonable, and this time of year has historically been good for stocks. The technical picture is muddled, but big gains to start this week, should they hold, would help increase the odds of further gains from a technical analysis perspective. As always, there are risks, but we continue to believe our year-end fair value target range for the S&P 500 of 2900–3000 is achievable, a gain of about 5% to the low end of the range from Friday’s close (2760).
The opinions voiced in this material are for general information only and are not intended to provide specific advice or recommendations for any individual. To determine which investment(s) may be appropriate for you, consult your financial advisor prior to investing. All performance referenced is historical and is no guarantee of future results.
The economic forecasts set forth in the presentation may not develop as predicted and there can be no guarantee that strategies promoted will be successful.
Investing involves risks including possible loss of principal. No investment strategy or risk management technique can guarantee return or eliminate risk in all market environments.
INDEX DESCRIPTIONS
The Standard & Poor’s 500 Index is a capitalization-weighted index of 500 stocks designed to measure performance of the broad domestic economy through changes in the aggregate market value of 500 stocks representing all major industries.
The modern design of the S&P 500 stock index was first launched in 1957. Performance back to 1928 incorporates the performance of predecessor index, the S&P 90.
This research material has been prepared by LPL Financial LLC.
To the extent you are receiving investment advice from a separately registered independent investment advisor, please note that LPL Financial LLC is not an affiliate of and makes no representation with respect to such entity.
Not FDIC or NCUA/NCUSIF Insured | No Bank or Credit Union Guarantee | May Lose Value | Not Guaranteed by Any Government Agency | Not a Bank/Credit Union Deposit.
RES 45294 1118 | For Public Use | Tracking #1-798536 (Exp. 12/19)