
The Bright Side
John Lynch Chief Investment Strategist, LPL Financial
Ryan Detrick, CMT Senior Market Strategist, LPL Financial
KEY TAKEAWAYS
- October was one of the worst months for stocks in years.
- Stocks have historically turned bullish into year-end following midterm elections.
- Within the four-year presidential cycle, this quarter and the following two quarters next year are historically the best for stocks.
-“It is always darkest just before the day dawneth.”-
Thomas Fuller | English theologian and historian
The quote above is better known today as “It is always the darkest just before dawn.” Well, October was one of the worst months we’ve seen in years for stocks, but we see a much brighter future. The next two months could have a nice year-end rally thanks to historically bullish seasonal patterns during midterm years and the extreme buying strength we saw last week.
Yes, there is a potential bright side to what could happen next!
GOOD RIDDANCE
After a six-month win streak, the S&P 500 Index came crashing down, losing nearly 10% from the recent peak and closing 6.9% lower in October. This was the worst month since September 2011. The action was even worse for the Nasdaq and Russell 2000 Index (small caps).
What really caused the October turbulence? Well, first things first: The S&P 500 was up six straight months and was heading into what has historically been the most volatile month of the year. Add in the continued worries over the Federal Reserve (Fed), the global economy, and trade tensions with China, and the market finally broke. In the end, we think it was Fed Chair Jay Powell’s comment on October 3 that we’re a “long way” from neutral that sparked much of the volatility. This statement made it appear the Fed was intent on continuing to increase interest rates, and it led to a reevaluation of risk assets.
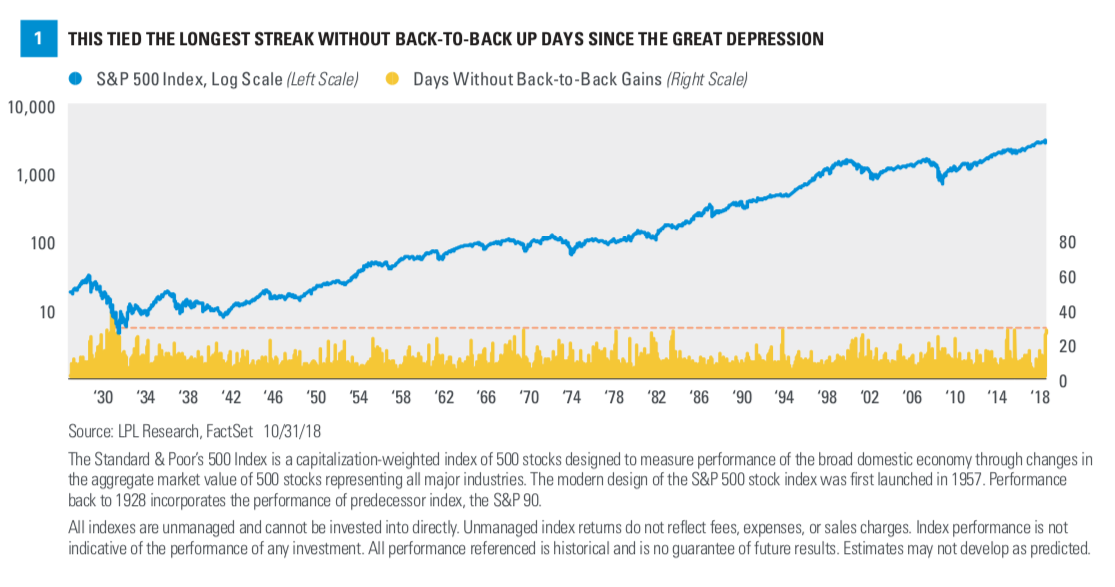
Two takeaways stand out that sum up how bad October was for equities. First off, the S&P 500 closed down 16 days last month, tying October 2008 for the most red days for any month in 10 years. Secondly, it took until the final two trading days of the month before the S&P 500 was up back-to-back days during the month.
Think about it like this: The S&P 500 just went
28 trading days without back-to-back up days. AsFigure 1 shows, that makes it tied (with several other times) for the longest streak without back-to-back gains since the Great Depression!
This helps to show just how persistent the weakness has been. There are some months that had larger drops, but few have ever seen the constant selling that October 2018 saw.
THE BRIGHT SIDE #1
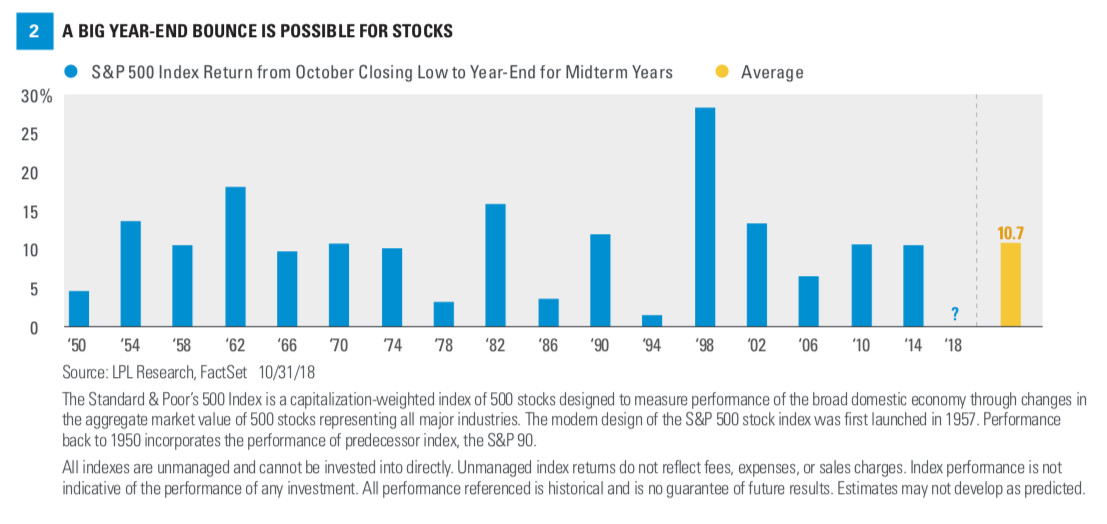
As bad as October was, there is a bright side to things. The S&P 500 closing low in October took place on October 29, at 2641.25, and history tells us lows in October tend to take place ahead of nice rallies, especially during midterm election years.
As Figure 2 shows, from the October closing low until the end of the year, the S&P 500 historically has been higher 18 out of 18 times, and is up a very impressive 10.7% on average. Given the average year since 1950 is up 7.4% from the October low until year-end, midterm years tend to have even more of a bullish bias. Things look brighter indeed.
THE BRIGHT SIDE #2
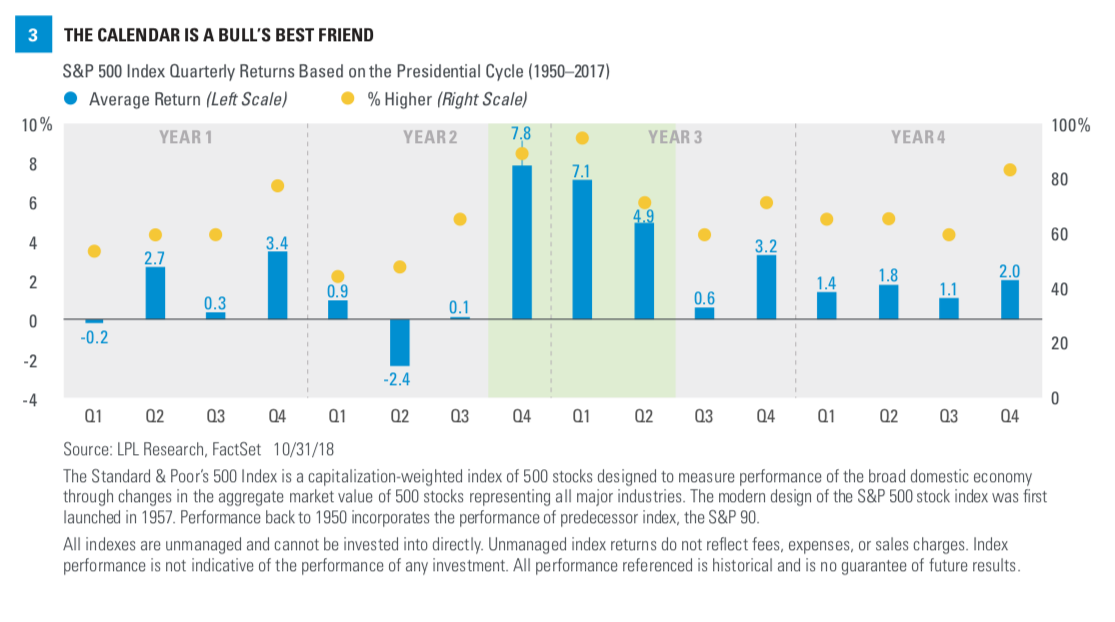
Looking at the entire four-year presidential cycle hints at more potential good news. As Figure 3 shows, the current quarter is historically the strongest quarter out of the entire cycle, while the next two quarters are quite strong as well. A closer look shows the fourth quarter of a midterm year hasn’t been lower since 1994, and even then it was down less than 1%. Additionally, since 1950, this quarter of a midterm year has been higher 15 out of 17 times.
The bottom line is October was a very rough month, but the quarter isn’t over yet and history would indicate a rally is quite possible heading into year-end.
Taking things a step further, the S&P 500 closed at a five-month low on October 29 and then gained 1% on three consecutive days. We found this rare event has happened only seven other times since 1950, and the near-term results are indeed quite strong. In fact, three months after the third consecutive 1% gain, the S&P 500 was higher every single time and up a median of 6.2%. Six months and 12 months later are strong as well, with median returns of 13.0% and 21.9%. Please read this recent blog for more thoughts on this bullish development.
CONCLUSION
October was a rough month for equities, but it’s important to remember that pullbacks are part
of investing. Fortunately, the overall economic backdrop remains solid and earnings are stellar. Valuations are at multi-year lows and the calendar could be a nice tailwind for the bulls in the near term. As F. Scott Fitzgerald wrote in Tender Is the Night, “In any case you mustn’t confuse a single failure with a final defeat.” We don’t think this bull market is over, and although October feels like a failure, don’t confuse it with a final defeat.
The opinions voiced in this material are for general information only and are not intended to provide specific advice or recommendations for any individual. To determine which investment(s) may be appropriate for you, consult your financial advisor prior to investing.
All performance referenced is historical and is no guarantee of future results.
The economic forecasts set forth in the presentation may not develop as predicted and there can be no guarantee that strategies promoted will be successful. Investing in stock includes numerous specific risks including: the fluctuation of dividend, loss of principal, and potential liquidity of the investment in a falling market. All investing involves risk including loss of principal.INDEX DESCRIPTIONS
The Standard & Poor’s 500 Index is a capitalization-weighted index of 500 stocks designed to measure performance of the broad domestic economy through changes in the aggregate market value of 500 stocks representing all major industries.
This research material has been prepared by LPL Financial LLC.
To the extent you are receiving investment advice from a separately registered independent investment advisor, please note that LPL Financial LLC is not an affiliate of and makes no representation with respect to such entity. Not FDIC or NCUA/NCUSIF Insured | No Bank or Credit Union Guarantee | May Lose Value | Not Guaranteed by Any Government Agency | Not a Bank/Credit Union Deposit.
RES 36388 1018 | For Public Use | Tracking #1-789495 (Exp. 11/19)