
GLOBAL EQUITY MARKET OUTLOOK:
FAVOR U.S.; STICK WITH EM
John Lynch Chief Investment Strategist, LPL Financial
Jeffrey Buchbinder CFA Equity Strategist, LPL Financial
KEY TAKEAWAYS
- U.S. economic and earnings growth continue to stand out globally and support our positive view of U.S. equities.
- We continue to see upside potential in emerging markets due to attractive valuations, recent economic growth, and potential U.S.-China trade resolution.
- Our cautious outlook for international developed equities is driven primarily by a lackluster economic growth outlook and structural concerns in Europe.
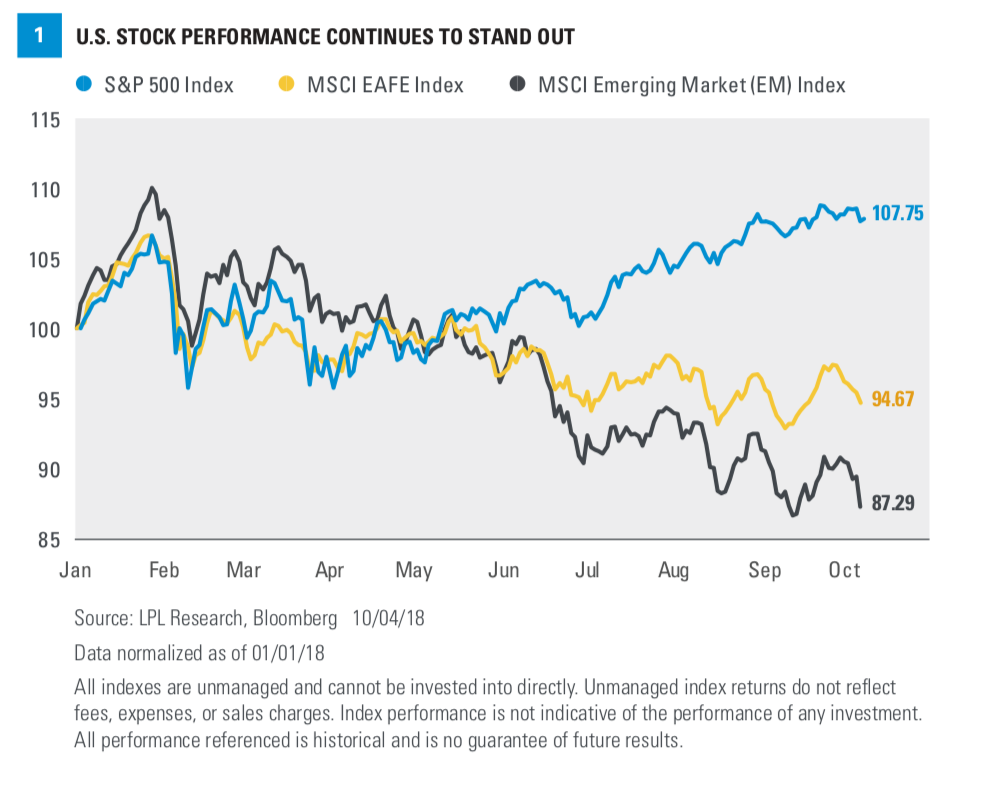
We continue to favor the United States and emerging markets (EM) over-developed foreign markets for global equity allocations. We see the U.S. economy as the primary driver of our forecast for 3.8% global gross domestic product (GDP) growth in 2018, supported by new fiscal policies, while Europe and Japan may lag.* The United States remains a global earnings standout as well. Despite underperformance this year, we continue to see upside potential in EM due to attractive valuations, recent economic growth, favorable demographics, and the potential for a resolution to the U.S.-China trade dispute later this year [Figure 1].
Economic Growth
U.S. GDP grew 4.2% annualized during the third quarter, may hit 3% for the year (based on Bloomberg consensus forecasts calling for 2.9%), and is accelerating. Meanwhile, GDP growth in the European Union has slowed each quarter this year and is not expected to reach 2% in the second half of 2018. The rise of populism, particularly in Italy, has highlighted the structural challenges and political risk that still exist in the region.
Japan’s economy bounced back nicely in the second quarter after contracting in the first, but consensus forecasts are calling for GDP growth marginally over 1% this year and next. Based on the latest purchasing manager’s surveys, Europe and Japan are both losing some momentum (see this week’s Weekly Economic Commentary for more on the economic outlook for international economies).
Earnings
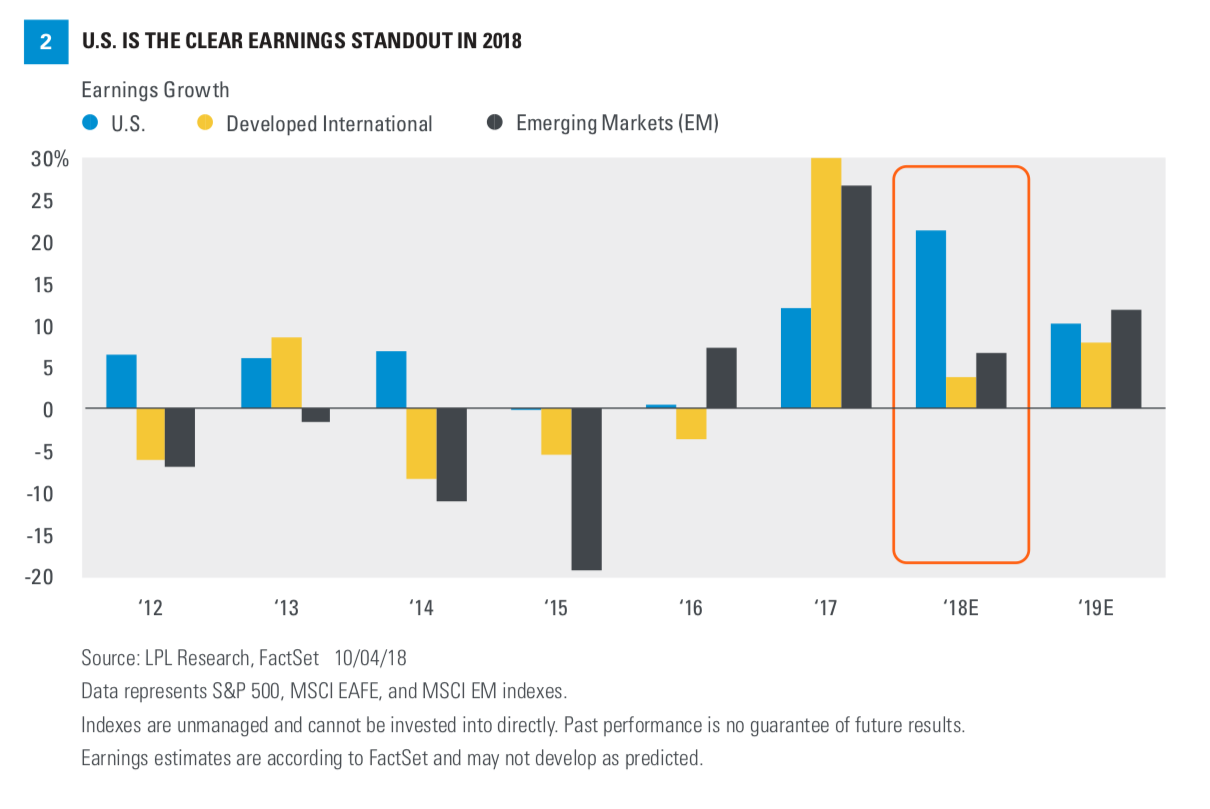
The story is similar for global earnings. Even without the benefit of the new tax law, the S&P 500 Index would be growing earnings at a low-double-digit rate (the tax reform boost to S&P 500 earnings is about 7%). That pace is still well ahead of consensus estimates** for MSCI EAFE Index earnings growth, at about 4% this year (EM is better at 7%) [Figure 2]. Revisions to developed international earnings estimates have also lagged the United States and, over the past month, EM as well. A strong U.S. dollar has been a drag on overseas earnings, but relative economic momentum in the U.S., buoyed by fiscal stimulus, is playing a bigger role.
** Earnings estimates are according to FactSet.
Valuations
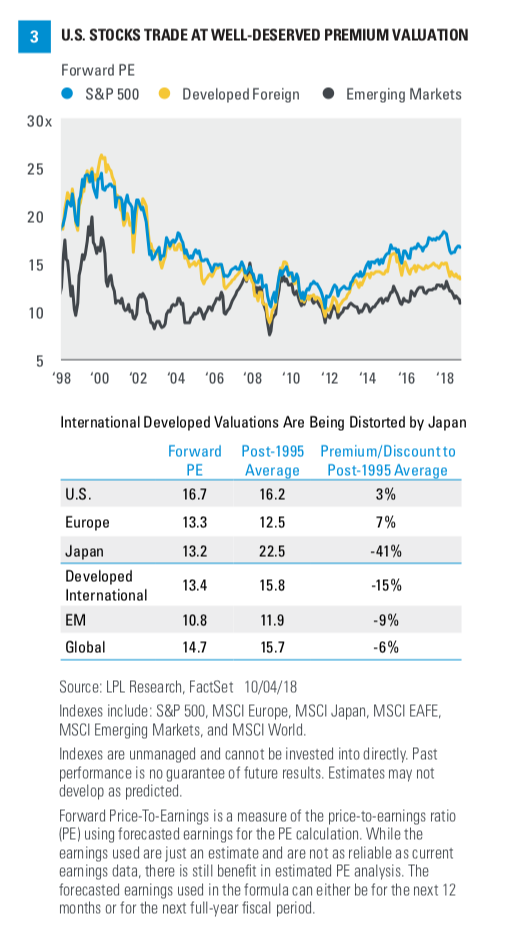
One of the most popular arguments in favor of developed international equities is cheaper valuations. The MSCI EAFE is currently trading at a nearly 20% discount to the S&P 500 on a forward price-to-earnings (PE) basis. That is quite a bit larger than its historical 20-year average discount at 6%. However, the sector makeup of the international index suggests that a discount is probably warranted. The international equity benchmark has a higher allocation to sectors that tend to trade at lower valuations, while the domestic equity benchmark (the S&P 500) has more exposure to sectors that tend to be more expensive such as technology and communication services, which now includes the mega-cap internet stocks. The technology sector, which tends to be more expensive, carries a 21% weight in the S&P 500 while the weight in the new communications services sector is about 10%, compared with 6% total in technology in the MSCI EAFE Index.
Also, consider that much of the discount for international equities relative to domestic is caused by Japanese stocks carrying low valuations [Figure 3]. Bottom line, while valuations seem very attractive for international developed equities on the surface, peeling back the onion reveals that those markets may not be quite as compelling as they appear. Factoring in fundamentals, we continue to underemphasize developed internationally in our tactical global equity allocations, though with a preference for Japan given attractive valuations and the potential upside from structural reforms. Strategically, over longer time periods, where valuations tend to matter more, we would be comfortable with more exposure to developed international equities.
BUY THE DIP IN EM?
We continue to view EM as an attractive opportunity, despite disappointing performance this year. The economic growth outlook for developing economies remains solid, having changed little in recent months amid pockets of financial stress such as Turkey and Argentina. Consensus GDP growth forecasts for EM of 5% for 2018 and 2019 (according to Bloomberg) are well above forecasts for the developed world, including the United States. Reasonable expectations for tariff impact suggest relatively limited drag, though we see a potential resolution to the trade dispute with China as a potential positive near-term catalyst.
Corporate fundamentals in EM generally look good, where many of the economies are earlier in their economic cycles than developed nations. EM earnings growth expectations are stronger than those in developed international markets (as shown in Figure 2). This year, EM is expected to grow earnings near 7%, almost double that of international developed markets (according to FactSet estimates). In 2019, EM earnings growth, at 11.6%, is expected to be about 4 percentage points stronger than international developed. EM earnings estimates through 2019 have risen over the past month, which is an encouraging sign and supportive of attractive valuations. The MSCI EM Index is trading at a nearly 10% discount to its historical average forward PE and a 35% discount to the forward PE for the S&P 500 Index.
Besides escalating trade tensions, primary risks for EM include sharply higher interest rates, further strength in the U.S. dollar, and more potential flare-ups in fiscally challenged EM countries. Because of these risks, we recommend investors keep allocations modestly sized. In terms of the risk of a stronger dollar, we believe the greenback has largely priced in Federal Reserve rate hikes and do not expect it to appreciate much further in the year ahead.
CONCLUSION
We continue to favor U.S. and EM equities over their developed international counterparts for tactical global equity allocations. The United States remains the standout in terms of economic and earnings growth, while we continue to see solid upside potential in EM. Slowing economic growth and structural concerns in Europe lead us to remain cautious tactically on developed international equities.
The opinions voiced in this material are for general information only and are not intended to provide specific advice or recommendations for any individual. To determine which investment(s) may be appropriate for you, consult your financial advisor prior to investing. All performance referenced is historical and is no guarantee of future results.
The economic forecasts set forth in the presentation may not develop as predicted and there can be no guarantee that strategies promoted will be successful.
Investing in foreign securities involves special additional risks. These risks include, but are not limited to, currency risk, political risk, and risk associated with varying accounting standards. Investing in emerging markets may accentuate these risks.
Because of its narrow focus, specialty sector investing, such as healthcare, financials, or energy, will be subject to greater volatility than investing more broadly across many sectors and companies.
Investing involves risks including possible loss of principal. No investment strategy or risk management technique can guarantee return or eliminate risk in all market environments.
All indexes are unmanaged and cannot be invested into directly. Unmanaged index returns do not reflect fees, expenses, or sales charges. Index performance is not indicative of the performance of any investment.
All information is believed to be from reliable sources; however, LPL Financial makes no representation as to its completeness or accuracy.
DEFINITIONS
The PE ratio (price-to-earnings ratio) is a measure of the price paid for a share relative to the annual net income or profit earned by the firm per share. It is a financial ratio used for valuation: a higher PE ratio means that investors are paying more for each unit of net income, so the stock is more expensive compared to one with lower PE ratio.
Gross domestic product (GDP) is the monetary value of all the finished goods and services produced within a country’s borders in a specific time period, though GDP is usually calculated on an annual basis. It includes all of private and public consumption, government outlays, investments, and exports less imports that occur within a defined territory.
INDEX DESCRIPTIONS
The Standard & Poor’s 500 Index is a capitalization-weighted index of 500 stocks designed to measure performance of the broad domestic economy through changes in the aggregate market value of 500 stocks representing all major industries.
The MSCI Emerging Markets Index is a free float-adjusted market capitalization index that is designed to measure equity market performance of emerging markets. The MSCI Emerging Markets Index consists of the following 21 emerging market country indices: Brazil, Chile, China, Colombia, Czech Republic, Egypt, Hungary, India, Indonesia, Korea, Malaysia, Mexico, Morocco, Peru, Philippines, Poland, Russia, South Africa, Taiwan, Thailand, and Turkey.
The MSCI All Country World Index is an unmanaged, free float-adjusted, market capitalization-weighted index composed of stocks of companies located in countries throughout the world. It is designed to measure equity market performance in global developed and emerging markets. The index includes reinvestment of dividends, net of foreign withholding taxes.
The MSCI EAFE Index is made up of approximately 1,045 equity securities issued by companies located in 19 countries and listed on the stock exchanges of Europe, Australia, and the Far East. All values are expressed in U.S. dollars. Past performance is no guarantee of future results.
This research material has been prepared by LPL Financial LLC.
To the extent you are receiving investment advice from a separately registered independent investment advisor, please note that LPL Financial LLC is not an affiliate of and makes no representation with respect to such entity.
Not FDIC or NCUA/NCUSIF Insured | No Bank or Credit Union Guarantee | May Lose Value | Not Guaranteed by Any Government Agency | Not a Bank/Credit Union Deposit.
RES 25451 0918 | For Public Use | Tracking #1-779253 (Exp. 10/19)