
KEY TAKEAWAYS
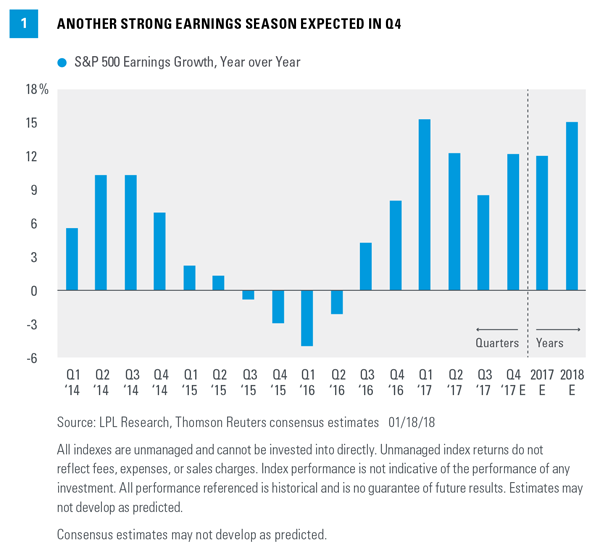
- We expect a solid fourth quarter earnings season and believe a 14-16% year-over-year increase in S&P 500 earnings is achievable.
- Economic surprises, strong manufacturing activity, and a weak U.S. dollar are a few of the primary reasons results may come in above expectations.
- Our positive earnings outlook for 2018 is well supported by our forecast for accelerating global growth and the new tax law.
FOURTH QUARTER EARNINGS SEASON: OFF TO A GOOD START
It’s early in the season, but with about 50 companies having reported fourth quarter results, S&P 500 Index earnings are tracking a 12% year-over-year increase [Figure 1]. A solid 79% of the companies have bested earnings estimates, while 87% have topped revenue targets, both well above recent and long-term averages. In this week’s commentary, we preview fourth quarter earnings season and reiterate our optimism for corporate profits in 2018.
SIX REASONS FOR OPTIMISM
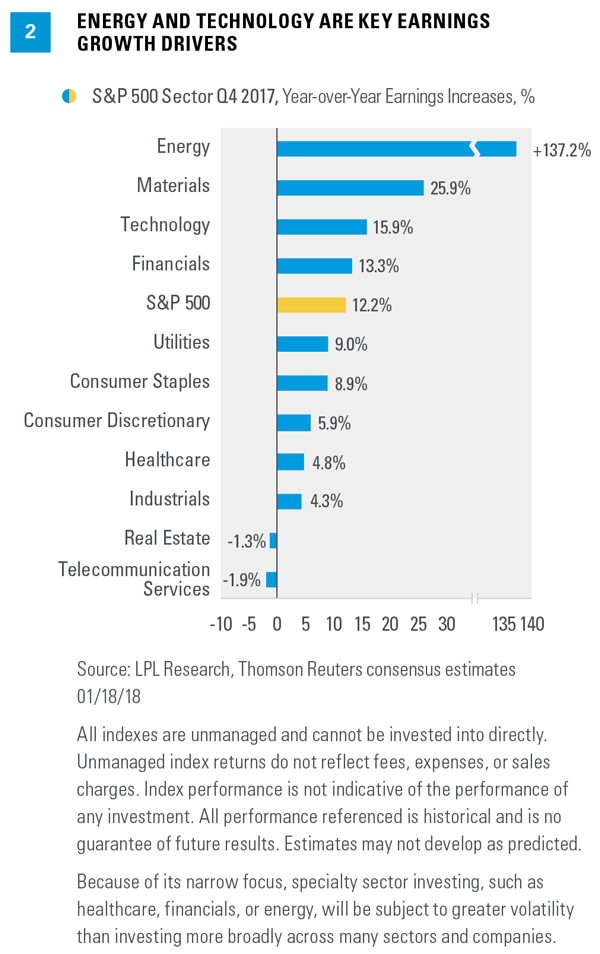
The S&P 500 has exceeded quarterly earnings expectations for 34 straight quarters and we see no reason why the fourth quarter of 2017 won’t make it 35. We believe an increase in the 14-16% range may be achievable, based on a 3-4% average upside to estimates historically. Though earnings growth may be driven mostly by technology and energy, growth is expected to be broad based, with a reasonable chance that all 11 sectors will report growth in earnings when all results are in [Figure 2]. Even excluding the sharp rebound in energy sector profits, and despite tougher comparisons against improving late-2016 earnings, a double-digit gain in S&P 500 earnings appears likely.
Here are the six primary reasons why we expect another good earnings season this quarter, relative to expectations:
- Economic surprises: The U.S. Citi Economic Surprise Index, a measure of economic data relative to expectations, is near record highs. When economic activity surprises to the upside, as it has consistently done in recent months, companies tend to beat estimates. Global economic surprises are also strongly positive, supporting multinationals’ earnings. This unexpected tailwind, combined with management teams’ tendency to be conservative and the lack of negative macroeconomic surprises, points to good upcoming results.
- Strong manufacturing activity: Manufacturing surveys (such as the Institute for Supply Management’s [ISM] Purchasing Managers’ Index) have historically been well correlated with earnings growth. That means the strong and generally rising global manufacturing indexes are a positive indicator for upcoming earnings reports. The U.S. ISM Manufacturing Index has been above 58 for five straight months, which is strongly expansionary. As with economic surprises, this is not just a U.S. story; manufacturing activity has picked up steam recently in Europe, Japan, and China too.
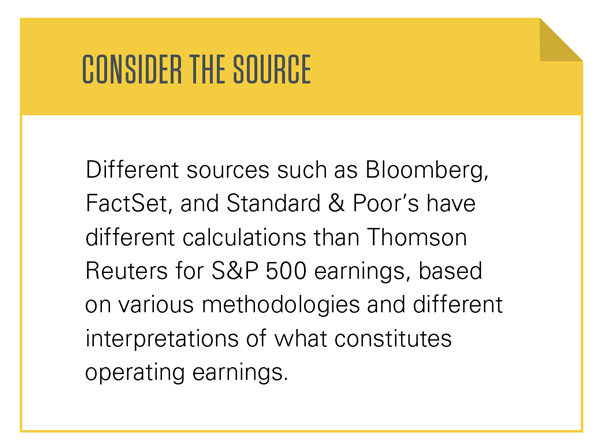
- Weak U.S. dollar: During the fourth quarter of 2017, the U.S. Dollar Index fell about 6% year over year, based on average prices [Figure 3]. Dollar weakness props up overseas earnings for U.S.-based multinationals and could present a tailwind for fourth quarter earnings given that roughly one third of S&P 500 companies’ revenue is earned outside of the United States.
- Pre-announcements: The ratio of negative to positive pre-announcements for the fourth quarter, at 1.6, is as favorable as it has been throughout the entire economic expansion. Though in line with last quarter, this ratio is better than the year-ago quarter (1.9) and the long-term average (2.8). Fewer negative profit warnings have historically led to better-than-expected earnings results.
- Stable estimate revisions: Analysts typically reduce earnings estimates during the quarter being reported. However, throughout the fourth quarter of 2017, estimates remained largely unchanged (while 2018 estimates rose, in part due to the tax law). Resilient estimates are a positive sign for fourth quarter results.
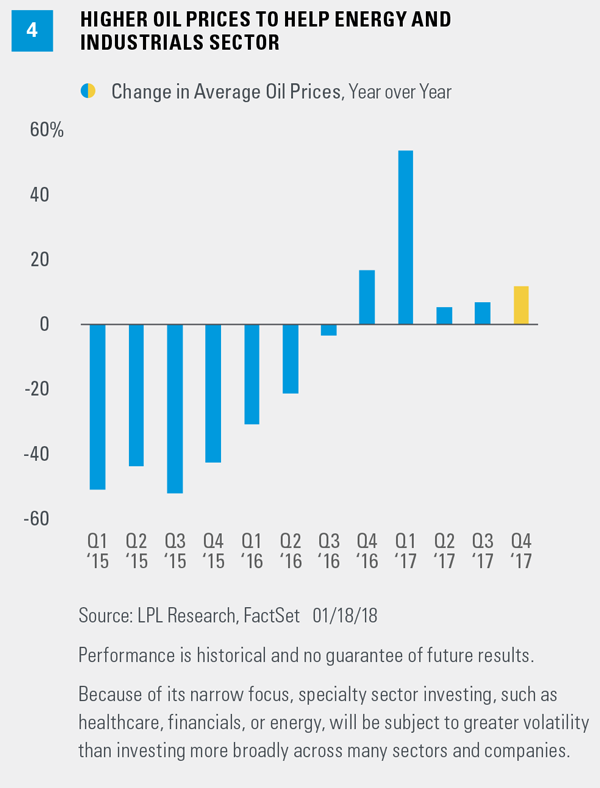
- Higher energy prices: Average crude prices were 12% higher in the fourth quarter of 2017 than the prior year [Figure 4]. If consumers pay more at the pump, and consumer spending is two-thirds of the U.S. economy, then how can higher oil prices help earnings? The answer is that S&P 500 earnings are more manufacturing and capital spending oriented than the U.S. economy. Higher oil prices mean more profits for energy companies (6% of the S&P 500 weighting) and also more investment in energy infrastructure via the industrial sector.
We believe these six factors will be the biggest drivers of potential earnings upside this earnings season. However, there is also a potential lift from hurricane-related rebuilding efforts, a positive, following the weather-related earnings drag in the third quarter, mostly from insurance losses.
And though not a clear negative, write downs related to the new tax law, particularly in the financials sector, have been garnering a lot of attention. We expect the market to look past these tax hits and focus on the benefits of the lower corporate rate, but the headlines aren’t helping investor sentiment. A lower tax rate leads to reductions in the value of future tax assets, and taxes paid up front for repatriating overseas cash, are both in the “pay now, benefit later” category.
ROBUST 2018 EARNINGS OUTLOOK
With the passage of the new tax law in late December, we upgraded our forecasts for earnings in 2018 (as well as our economic growth and S&P 500 return forecasts). Specifically, the new tax law and the potential boost to corporate profitability led us to raise our 2018 S&P 500 earnings forecast from $142.50 to $147.50, representing annual growth in the 12-13% range, which may prove conservative.
As noted in our Outlook 2018: Return of the Business Cycle, we believe 2018 earnings will be supported by stronger global economic growth, a pickup in business spending, and strong manufacturing activity in the United States. We also think operating margins will remain strong and stable, thanks to our expectation for only modest upward pressure on wages and other input costs. The increase in 2018 estimates, even if largely due to analysts factoring in the new tax law, is encouraging as 2018 begins.
CONCLUSION
We expect a strong fourth quarter earnings season and a mid-teens increase in S&P 500 earnings. Looking ahead, we believe our forecast for low teens earnings growth in 2018 is well supported by our forecast for accelerating global economic growth and the new tax law. Although we may see a pickup in volatility in the near term, we believe our earnings expectations for 2018 support further gains for stocks over the balance of this year.
IMPORTANT DISCLOSURES
The opinions voiced in this material are for general information only and are not intended to provide specific advice or recommendations for any individual. To determine which investment(s) may be appropriate for you, consult your financial advisor prior to investing. All performance referenced is historical and is no guarantee of future results.
The economic forecasts set forth in the presentation may not develop as predicted and there can be no guarantee that strategies promoted will be successful.
Investing in stock includes numerous specific risks including: the fluctuation of dividend, loss of principal, and potential liquidity of the investment in a falling market.
Because of its narrow focus, specialty sector investing, such as healthcare, financials, or energy, will be subject to greater volatility than investing more broadly across many sectors and companies.
The fast price swings in commodities and currencies will result in significant volatility in an investor’s holdings.
All investing involves risk including loss of principal.
INDEX DESCRIPTIONS
The Standard & Poor’s 500 Index is a capitalization-weighted index of 500 stocks designed to measure performance of the broad domestic economy through changes in the aggregate market value of 500 stocks representing all major industries.
The Institute for Supply Management (ISM) Manufacturing Index is an economic indicator derived from monthly surveys of private sector companies, and is intended to show the economic health of the U.S. manufacturing sector. A PMI of more than 50 indicates expansion in the manufacturing sector, a reading below 50 indicates contraction, and a reading of 50 indicates no change.
The U.S. Citi Economic Surprise Index measures actual economic surprises relative to expectations. A positive reading means that data have been stronger than expected, while a negative reading means that data have been worse than expected.
The U.S. Dollar Index measures the performance of the U.S. dollar against a basket of foreign currencies: EUR, JPY, GBP, CAD, CHF and SEK. The U.S. Dollar Index goes up when the dollar gains “strength” compared to other currencies.
This research material has been prepared by LPL Financial LLC.
To the extent you are receiving investment advice from a separately registered independent investment advisor, please note that LPL Financial is not an affiliate of and makes no representation with respect to such entity.
Not FDIC or NCUA/NCUSIF Insured | No Bank or Credit Union Guarantee | May Lose Value | Not Guaranteed by Any Government Agency | Not a Bank/Credit Union Deposit
Tracking #1-690349 (Exp. 01/19)