KEY TAKEAWAYS
- The S&P 500 is historically overbought after a very persistent bid the past year.
- Fortunately, history suggests longer-term gains are quite strong after being overbought.
- Market sentiment is flashing some near-term concerns.
WHEN OVERBOUGHT IS BULLISH
The bull market continues to march higher. The S&P 500 Index is near one of the most overbought levels in history and this has many wondering how much longer the rally can continue. The longer-term technical indicators continue to look strong, but sentiment is flashing some warning signs suggesting market volatility could finally be heating up.
MOST OVERBOUGHT IN 22 YEARS
How can we sum up the events of 2017? Although our favorite story might be that the world’s largest snowball fight was canceled because of too much snow, this year will be remembered for being one of the least volatile years in history. In other words, this is another reminder that nearly anything is possible when it comes to markets. Put simply, we are currently in the midst of the longest streak ever without a 3% correction for the S&P 500, and potentially the first year in the history of the S&P 500 to have a total return monthly gain all 12 months. Add it all up and equities are the most overbought they’ve been in 22 years.
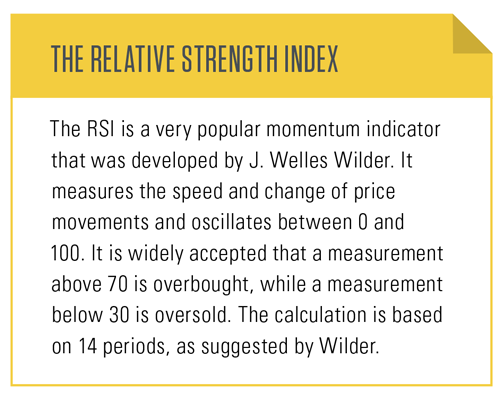
The Relative Strength Index (RSI) is a popular momentum indicator and as Figure 1 shows, it is the most overbought it has been since 1995. This has many market participants suggesting equity markets are ripe for a substantial pullback at any time.
Here’s where things get interesting. There’s an old technical analysis saying that “the most bullish thing a market can do is get overbought and stay that way.” Sure enough, when the S&P 500 weekly RSI has gotten over the historically super overbought level of 80 (like recently), the returns have been better over the longer term.
We’ll be the first to admit that a normal correction of 5-10% could happen at any time given how long it has been since the last pullback. But it is important to note that any pullbacks could be a nice opportunity to add to positions. As seen in Figure 2, the S&P 500 has reached this overbought level only 13 other times dating back to 1950.* Somewhat surprisingly, the future returns are actually stronger after such periods of overbought natures. For instance, a year after being overbought, the S&P 500 is up 12.8% on average versus the average gain of 8.8% and higher 12 out of 13 times, which suggests there may be a good chance for solid market returns next year.
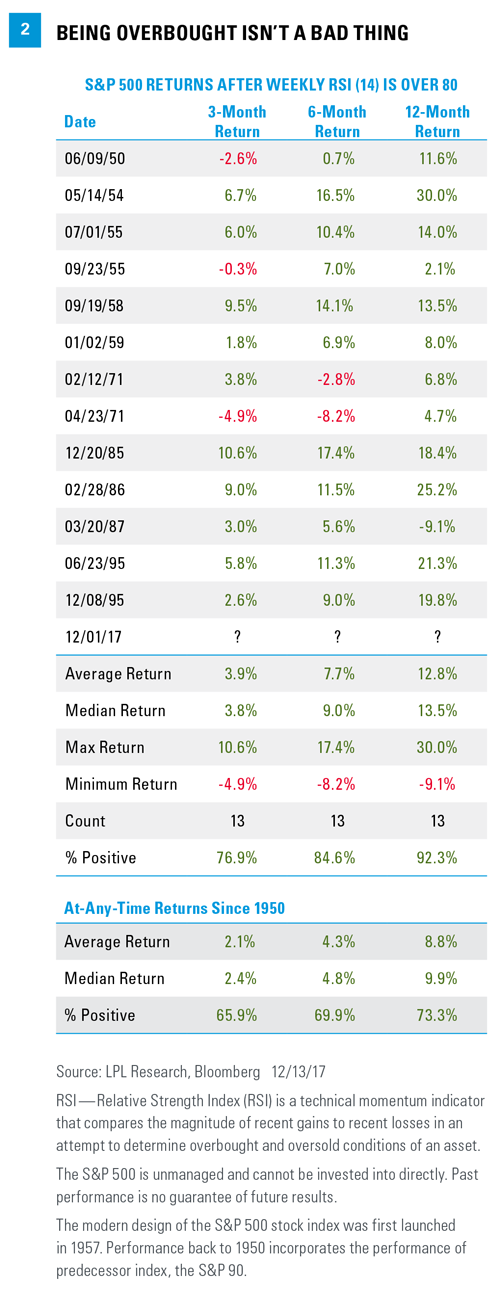
*Please note: The modern design of the S&P 500 stock index was first launched in 1957. Performance back to 1950 incorporates the performance of predecessor index, the S&P 90.
INVESTOR SENTIMENT
As we laid out in our Outlook 2018: Return of the Business Cycle publication, the global economy is on firm footing and is being led by a resurgence in earnings. The overall technical backdrop continues to look strong as well, but one near-term worry we have is that sentiment is getting quite frothy here.
History has shown us that the crowd can be right during trends, but it also tends to be wrong at extremes. This is why sentiment can be an important contrarian indicator, because if everyone who might become bearish has already sold, only buyers are left. The reverse also applies.
In the near term, we see the potential for some concern, as confidence is high and worries are few, which could potentially be a contrarian warning signal.
- The popular Bank of America/Merrill Lynch Global Fund Manager Survey found that a record number of investors say they are taking above-normal levels of risk in their investments. Additionally, a record number are also expecting a ‘Goldilocks’ scenario of above-trend growth and below-trend inflation.
- Derivatives are suggesting a good deal of complacency, according to the Chicago Board of Options Exchange (CBOE). The 20-day moving average of bullish versus bearish derivatives on equities is at its lowest level this year, suggesting many traders are quite comfortable and optimistic.
- Sentiment polls are showing a good deal of excitement. For instance, the 10-week moving average of bulls in the Investors Intelligence U.S. Advisors’ Sentiment survey of newsletter writers is at its highest level going back 25 years.
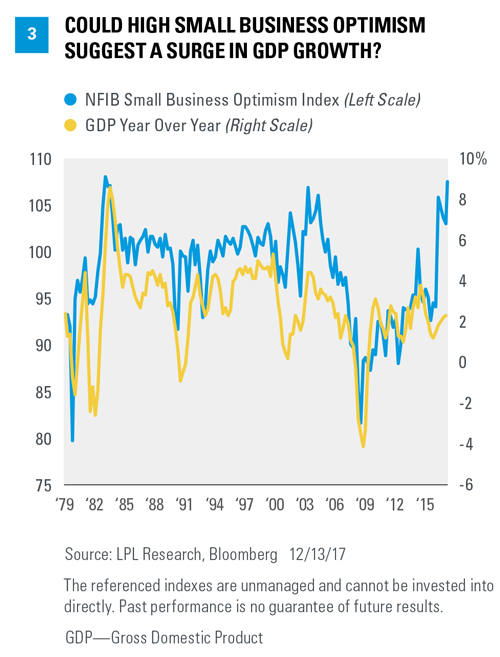
- According to data from the Federal Reserve Bank Z.1 report, during the third quarter of 2017, household and nonprofit’s stock holdings jumped to 36.3% of all total financial assets. This is the highest level since 2000 – the tech bubble is the only other time households owned more stocks. The Conference Board’s Consumer Confidence Survey shows confidence is at the highest level since late 2000, and a recent National Federation of Independent Business (NFIB) survey found that small business optimism is at its highest level in 34 years. Although high optimism might sound like a contrarian indicator, as Figure 3 shows, in this case it could actually be a sign of stronger gross domestic product (GDP) growth over the coming quarters.
- Last, it is important to note that we still aren’t seeing huge flows into equities, as Investment Company Institute (ICI) data showed seven of the past eight months experienced outflows from domestic equity mutual funds and exchange-traded funds.
CONCLUSION
This has been a historic year for the bulls and one that many didn’t expect would be this tranquil. Because of the consistent move higher with no pullbacks, the S&P 500 is the most overbought it has been in 22 years. Although some volatility appears likely in the near term, history suggests being this overbought is a bullish event. We will continue to watch certain factors, however, that could suggest a contrarian warning.
Thanks to Dave Tonaszuck for his contributions to the publication this week.
Please note, this will be our last Weekly Market Commentary of the year, as we will take next week off to be with our families. See you in 2018!
IMPORTANT DISCLOSURES
The opinions voiced in this material are for general information only and are not intended to provide specific advice or recommendations for any individual. To determine which investment(s) may be appropriate for you, consult your financial advisor prior to investing.
All performance referenced is historical and is no guarantee of future results.
The economic forecasts set forth in the presentation may not develop as predicted and there can be no guarantee that strategies promoted will be successful.
The economic forecasts set forth in the presentation may not develop as predicted.
Investing in stock includes numerous specific risks including: the fluctuation of dividend, loss of principal and potential illiquidity of the investment in a falling market.
All investing involves risk including loss of principal.
There is no guarantee that a diversified portfolio will enhance overall returns or outperform a nondiversified portfolio. Diversification does not ensure against market risk.
INDEX DESCRIPTIONS
The Standard & Poor’s 500 Index is a capitalization-weighted index of 500 stocks designed to measure performance of the broad domestic economy through changes in the aggregate market value of 500 stocks representing all major industries.
The small business optimism index is compiled from a survey that is conducted each month by the National Federation of Independent Business (NFIB) of its members. The index is a composite of ten seasonally adjusted components based on questions on the following: plans to increase employment, plans to make capital outlays, plans to increase inventories, expect economy to improve, expect real sales higher, current inventory, current job openings, expected credit conditions, now a good time to expand, and earnings trend.
This research material has been prepared by LPL Financial LLC.
To the extent you are receiving investment advice from a separately registered independent investment advisor, please note that LPL Financial is not an affiliate of and makes no representation with respect to such entity.
Not FDIC or NCUA/NCUSIF Insured | No Bank or Credit Union Guarantee | May Lose Value | Not Guaranteed by Any Government Agency | Not a Bank/Credit Union Deposit
Tracking #1-678618 (Exp. 12/18)