Should Friday’s strong jobs report (released August 5) lead investors to sell stocks and worry more about their bond portfolios? First, on the stock side, keep in mind that the stock market has historically done well after the initial Federal Reserve (Fed) rate hike of an economic cycle, which came in December 2015. Some of you may be wondering if we already got that historical bounce after the S&P 500 hit another all-time high immediately following the jobs report, gaining 0.9% Friday on the news.
In a sense, we may have already gotten the gains that typically have come following initial rate hikes: the S&P 500 is up about 8% (with Friday’s gains) since the Fed hiked rates on December 16, 2015. The average post-WWII gain in the S&P 500 in the year following the first rate hike of an economic cycle is 8%. That suggests stocks may end the year about where they are now, consistent with our Midyear Outlook 2016.*
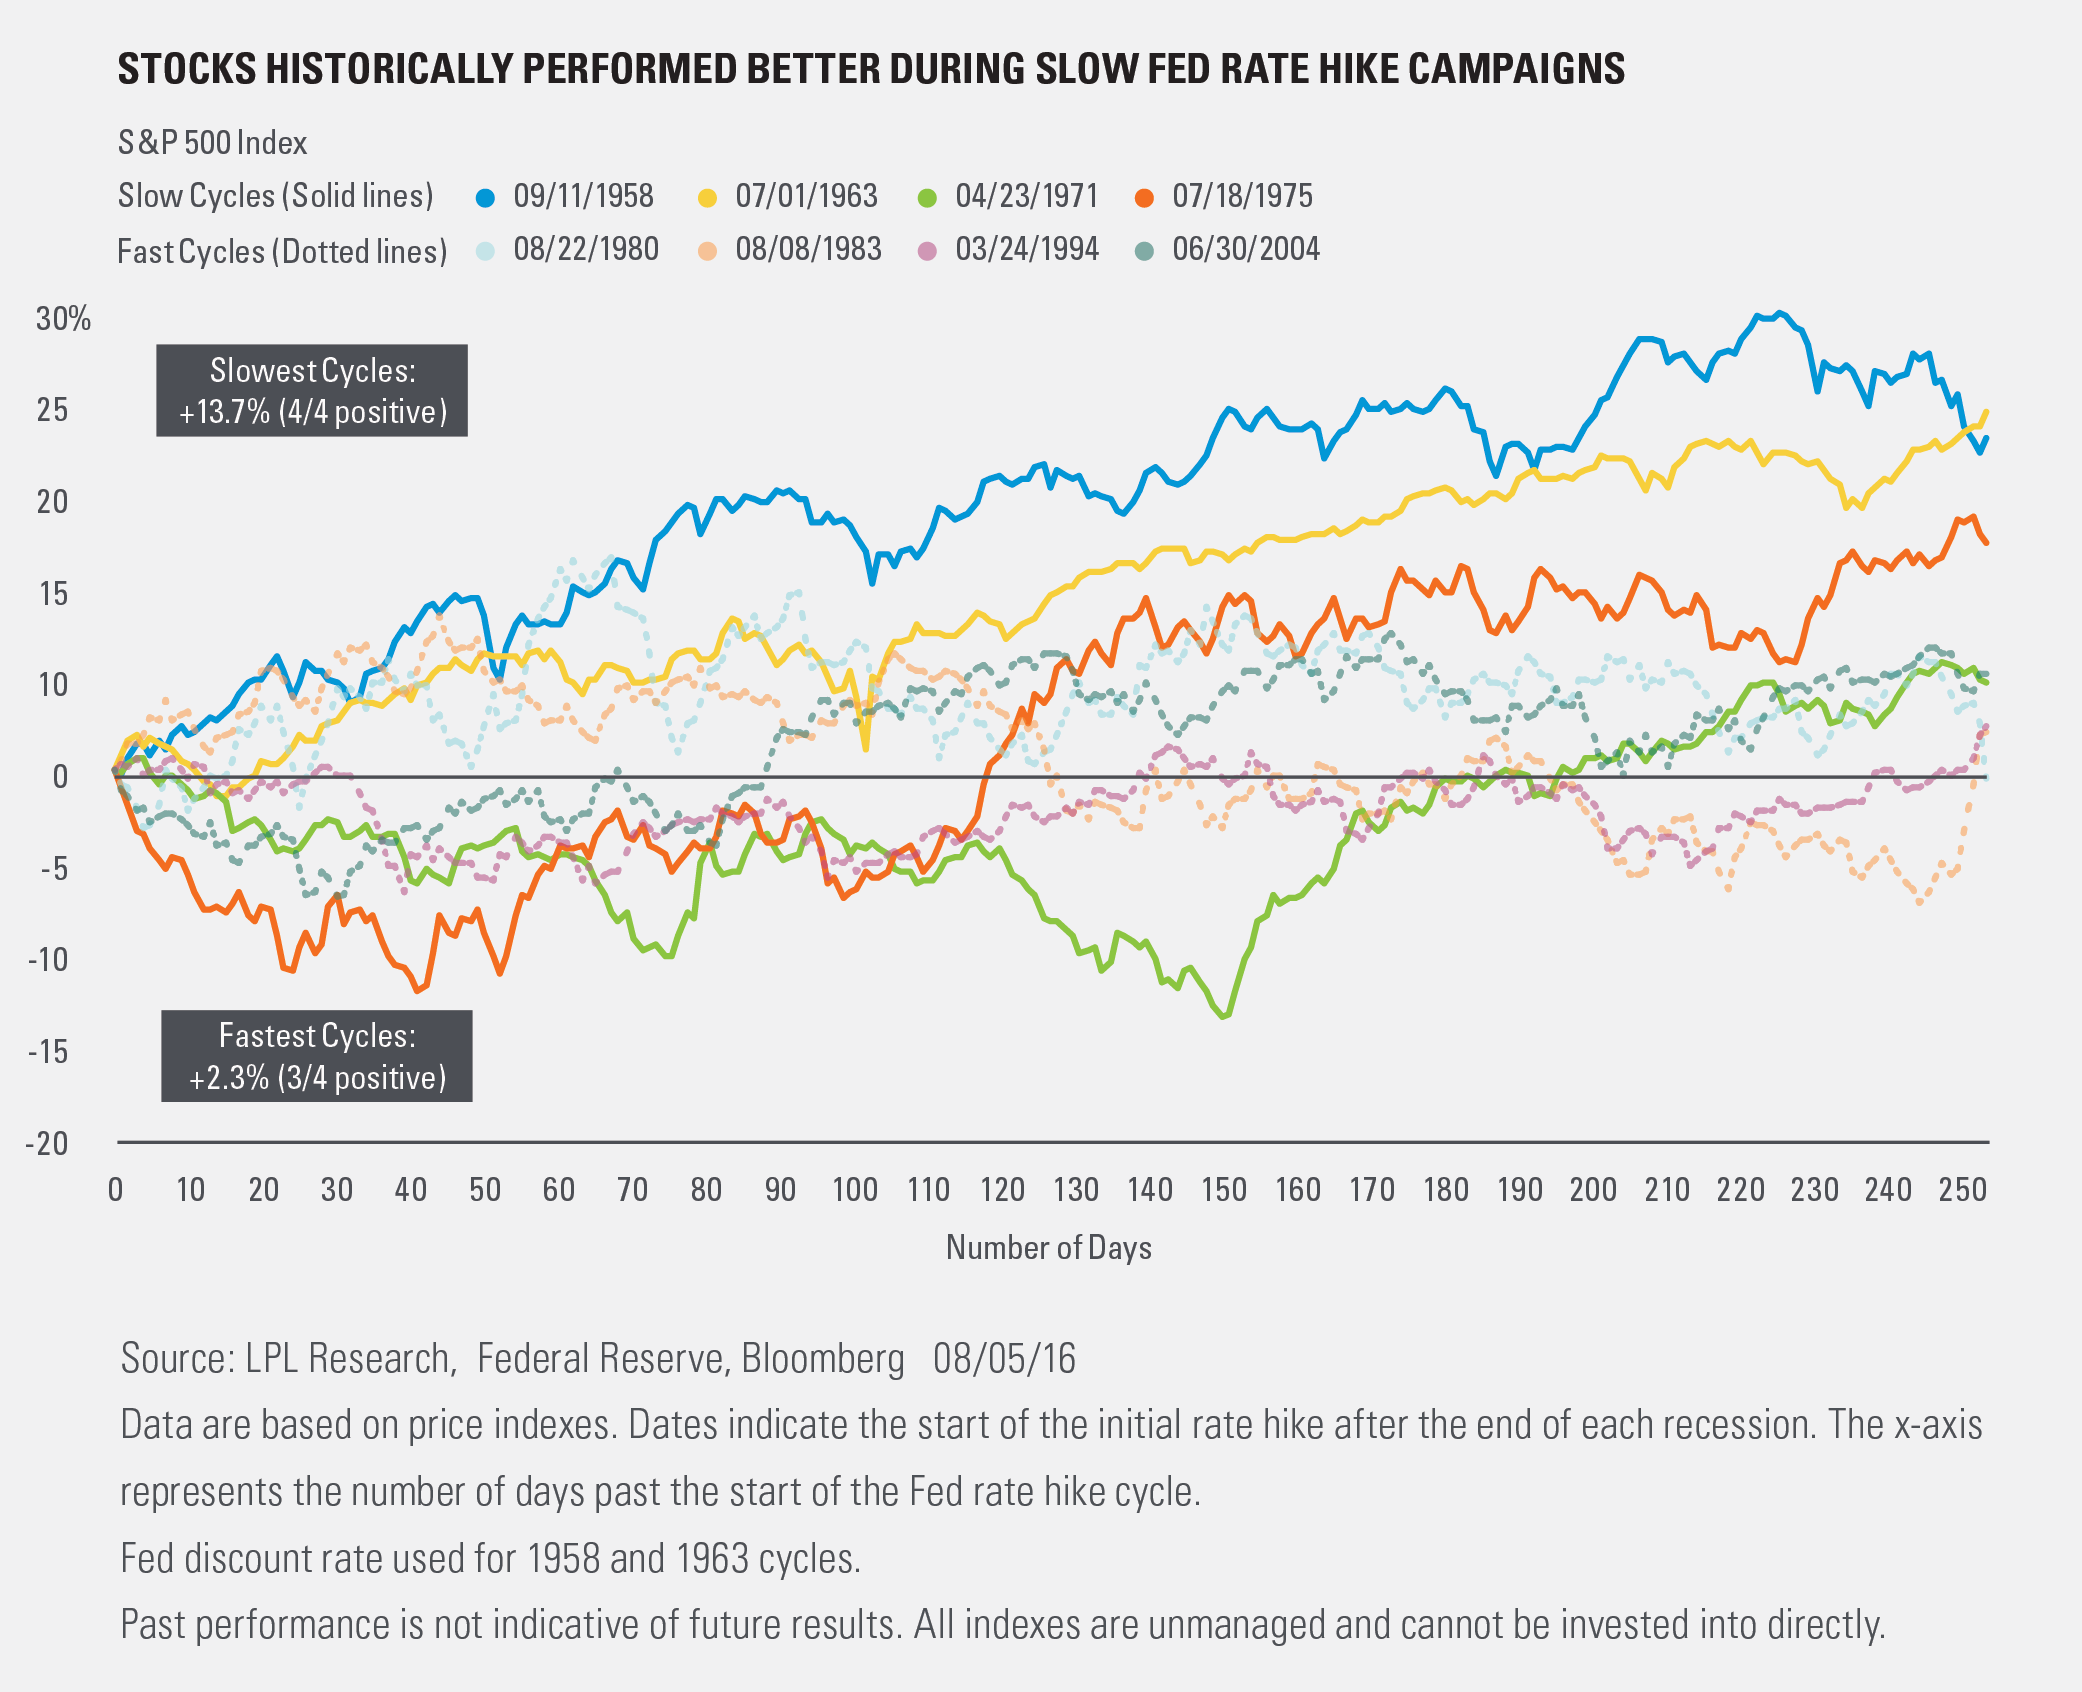
But this cycle has been gradual, suggesting stocks may be biased to the upside. The average gain for stocks during the slower Fed rate hike cycles—and there is no doubt this one falls into that category—has been a very strong 13.7% (see the figure below). Four rate hike cycles fall into this category out of the eight we analyzed. This is a positive data point, and the odds that our year-end S&P 500 forecast proves to be overly conservative are rising; but at this point we are sticking with our forecast of mid-single-digit gains for the full year.
Turning to the bond market, the reaction to the jobs report was more muted than one might expect, possibly in part because of the lack of acceleration in wage growth (average hourly earnings rose 2.6% year over year, even with June 2016). Following the report, the odds of a September 2016 Fed rate hike rose just 8%: from 18% to 26%. November 2016 got a similar bump (20% to 28%), while December odds rose a bit more (37% to 48%) but still remain slightly below the 50% mark. The 10-year Treasury yield rose 8 basis points (0.08%) to a still very low 1.58%—a big move, but not enough to break the multi-year downtrend and not enough for us to change our expectation for modestly rising interest rates over the balance of the year.
How this gap is resolved, between the market’s expectations for Fed rate hikes and what has been communicated by Fed officials, remains one of the keys for markets—especially fixed income markets—in 2016. Our best guess is the next rate hike comes in December. We continue to view bonds as an important diversifier in portfolios and continue to favor investment-grade corporate bonds and mortgages with only slightly below-benchmark durations, as low yields globally are likely to continue to limit the size of the moves higher in interest rates.
IMPORTANT DISCLOSURES
*We continue to expect mid-single-digit returns for the S&P 500 in 2016, consistent with historical mid-to-late economic cycle performance. We expect those gains to be derived from mid- to high-single-digit earnings growth over the second half of 2016, supported by steady U.S. economic growth and stability in oil prices and the U.S. dollar. A slight increase in price-to-earnings ratios (PE) above 16.6 is possible as market participants gain greater clarity on the U.S. election and the U.K.’s relationship with Europe.
Past performance is no guarantee of future results. All indexes are unmanaged and cannot be invested into directly. Unmanaged index returns do not reflect fees, expenses, or sales charges. Index performance is not indicative of the performance of any investment.
The economic forecasts set forth in the presentation may not develop as predicted.
The opinions voiced in this material are for general information only and are not intended to provide or be construed as providing specific investment advice or recommendations for any individual security.
Stock investing involves risk including loss of principal.
The S&P 500 Index is a capitalization-weighted index of 500 stocks designed to measure performance of the broad domestic economy through changes in the aggregate market value of 500 stocks representing all major industries.
The monthly jobs report (known as the employment situation report) is a set of labor market indicators based on two separate surveys distributed in one monthly report by the U.S. Bureau of Labor Statistics (BLS). The report includes the unemployment rate, non-farm payroll employment, the average number of hours per week worked in the non-farm sector, and the average basic hourly rate for major industries.
Bonds are subject to market and interest rate risk if sold prior to maturity. Bond values and yields will decline as interest rates rise, and bonds are subject to availability and change in price.
This research material has been prepared by LPL Financial LLC.
To the extent you are receiving investment advice from a separately registered independent investment advisor, please note that LPL Financial LLC is not an affiliate of and makes no representation with respect to such entity.
Not FDIC/NCUA Insured | Not Bank/Credit Union Guaranteed | May Lose Value | Not Guaranteed by any Government Agency | Not a Bank/Credit Union Deposit
Securities and Advisory services offered through LPL Financial LLC, a Registered Investment Advisor
Member FINRA/SIPC
Tracking #1-523647 (Exp. 08/17)