Highlights
- High-yield has continued to rally recently despite weaker oil prices.
- Investors can still potentially benefit from a small allocation due to the asset class’s notable yield in a low-yield environment.
- Caution remains warranted, as oil may again drive the market.
Click here to download a PDF of this report.
High-Yield Rally Continues Despite Headwinds
High-yield’s rally during July was a continuation of the strength that began in mid-February, but with one important difference: the market has continued to rally recently despite oil price weakness. High-yield returned 2.7% in July, bringing the asset class’s year-to-date total return to an impressive 12.0% (based on the Barclays U.S. High Yield Index).
Notable Performance
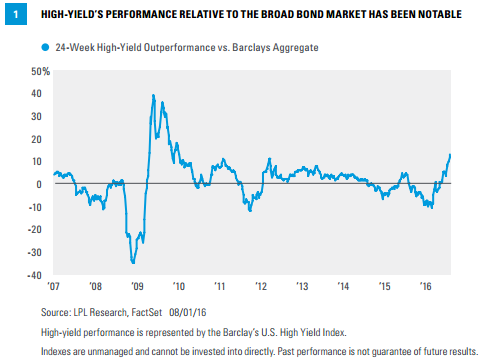
The continued rally of high-yield, especially relative to the Barclays Aggregate, has been noteworthy. Since the high-yield market’s recent bottom on February 11, 2016, the high-yield market has outperformed the Aggregate by more than 13% over the 24-week period (through July 29, 2016). This is the largest outperformance during the last 10 years, outside of the recovery from the Great Recession [Figure 1].
Oil Still the Dominant Driver
High-yield’s rally has continued as the market has shown resilience despite weaker oil prices [Figure 2].
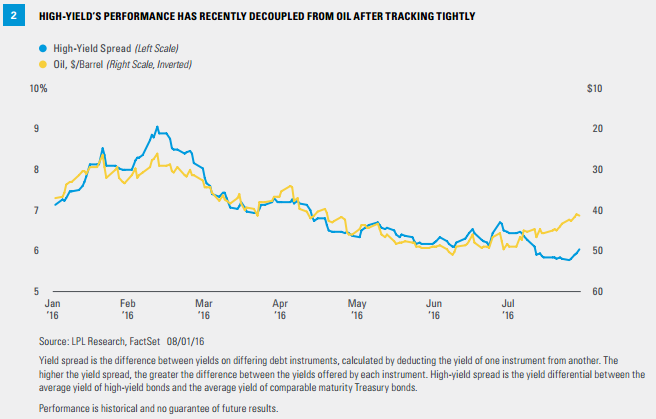
Although the decoupling is notable, we still believe that oil will be the primary driver of high-yield strength or weakness in the near future, and sufficient caution should be exercised. Price action on August 1, 2016, confirmed that this relationship is still strong; oil’s 3.7% decline to $40 per barrel led to a -0.6% return for the high-yield market.
The Worst May Be Over
Based on our research, current yield spreads imply a forward one-year default rate of 4.3% for the overall high-yield market, 7.3% for the high-yield energy sector, and 3.8% for high-yield excluding the energy sector. Markets are forward looking, and while defaults have increased - and may continue to increase over the short term - markets are indicating an expectation for them to slow over the next year. In fact, this has already been the case, as these implied default figures have come down over the month of July (the market-implied default rate for high-yield overall was 5.0% at the end of June).
On a lookback basis, Moody’s default rate for high-yield recently notched up slightly to 4.5% as of June 30, 2016, up from 4% as of March 31, 2016. A deceleration in the rise of the default rate in future readings would also indicate that the bulk of defaults have already transpired. We believe spreads at their current levels are roughly fair, bordering on slightly expensive, but provide little room for error if defaults continue to rise. The high-yield market, however, is suggesting that the worst may be behind us.
Scenario Analysis
Despite the recent decoupling, we believe high-yield’s performance over the near term remains largely dependent on the price of oil. As oil settled at $40 per barrel on August 1, 2016, the move from here may indicate where the high-yield market is headed over the short term. A material move downward into the low to mid- $30s, with prices sustained at those levels, may prompt weakness in high-yield. That being said, another rally of oil into the upper $40s may propel high-yield further still. Direction aside, a single variable being such a powerful potential driver of returns creates an added risk for high-yield investors.
Nevertheless, we remain in a low-yield world, in which many segments of the bond market are at or near historically high valuations, and we believe a small allocation to high-yield bonds can potentially add value. In a range-bound interest rate backdrop, interest income can be a powerful driver of return. Scenario analysis can help gauge potential return prospects for high-yield bonds [Figure 3].
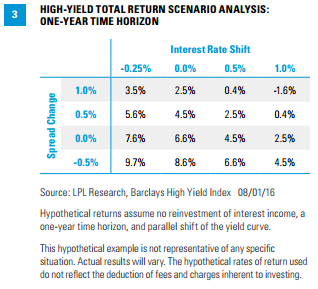
Figure 3 indicates that the one-year total return for the Barclays U.S. High Yield Index, assuming no change in spreads and a 0.5% increase in interest rates, is 4.5%, a decent reading in our current low-yield/low-return environment. Comparisons to the broader bond market can also be helpful: a 0.5% increase in interest rates could result in a 0.4% one-year total return for the Barclays U.S. Aggregate Index.
Conclusion
The high-yield market has continued to rally, despite the fact that oil has weakened as of late, resulting in the first meaningful decoupling of the recent past. Although this decoupling has been positive for the high-yield market, we believe oil remains its key risk driver. Still, investors may potentially benefit from a small allocation due to the asset class’s notable yield in a low-yield environment. Caution remains warranted, however, as oil may again drive the market.
IMPORTANT DISCLOSURES
The opinions voiced in this material are for general information only and are not intended to provide specific advice or recommendations for any individual. To determine which investment(s) may be appropriate for you, consult your financial advisor prior to investing. All performance reference is historical and is no guarantee of future results. All indexes are unmanaged and cannot be invested into directly.
The economic forecasts set forth in the presentation may not develop as predicted and there can be no guarantee that strategies promoted will be successful.
Bonds are subject to market and interest rate risk if sold prior to maturity. Bond values and yields will decline as interest rates rise, and bonds are subject to availability and change in price.
Government bonds and Treasury bills are guaranteed by the U.S. government as to the timely payment of principal and interest and, if held to maturity, offer a fixed rate of return and fixed principal value. However, the value of fund shares is not guaranteed and will fluctuate.
High-yield/junk bonds (grade BB or below) are not investment grade securities, and are subject to higher interest rate, credit, and liquidity risks than those graded BBB and above. They generally should be part of a diversified portfolio for sophisticated investors.
Commodity-linked investments may be more volatile and less liquid than the underlying instruments or measures, and their value may be affected by the performance of the overall commodities baskets as well as weather, geopolitical events, and regulatory developments.
INDEX DESCRIPTIONS
The Barclays U.S. Aggregate Bond Index is a broad-based flagship benchmark that measures the investment-grade, U.S. dollar-denominated, fixed-rate taxable bond market. The index includes Treasuries, government-related and corporate securities, MBS (agency fixed-rate and hybrid ARM pass-throughs), ABS, and CMBS (agency and non-agency).
The Barclays U.S. Corporate High Yield Index measures the market of USD-denominated, noninvestment-grade, fixed-rate, taxable corporate bonds. Securities are classified as high yield if the middle rating of Moody’s, Fitch, and S&P is Ba1/BB+/BB+ or below, excluding emerging market debt.
The Barclays U.S. Corporate High Yield Energy Index covers the universe of fixed rate, non-investment grade debt. Eurobonds and debt issues from countries designated as emerging markets (sovereign rating of Baa1/BBB+/BBB+ and below using the middle of Moody’s, S&P, and Fitch) are excluded, but Canadian and global bonds (SEC registered) of issuers in non-EMG countries are included. Original issue zeroes, step-up coupon structures, 144-As and pay-in-kind bonds (PIKs, as of October 1, 2009) are also included.
RES 5602 0816 | Tracking #1-522022