
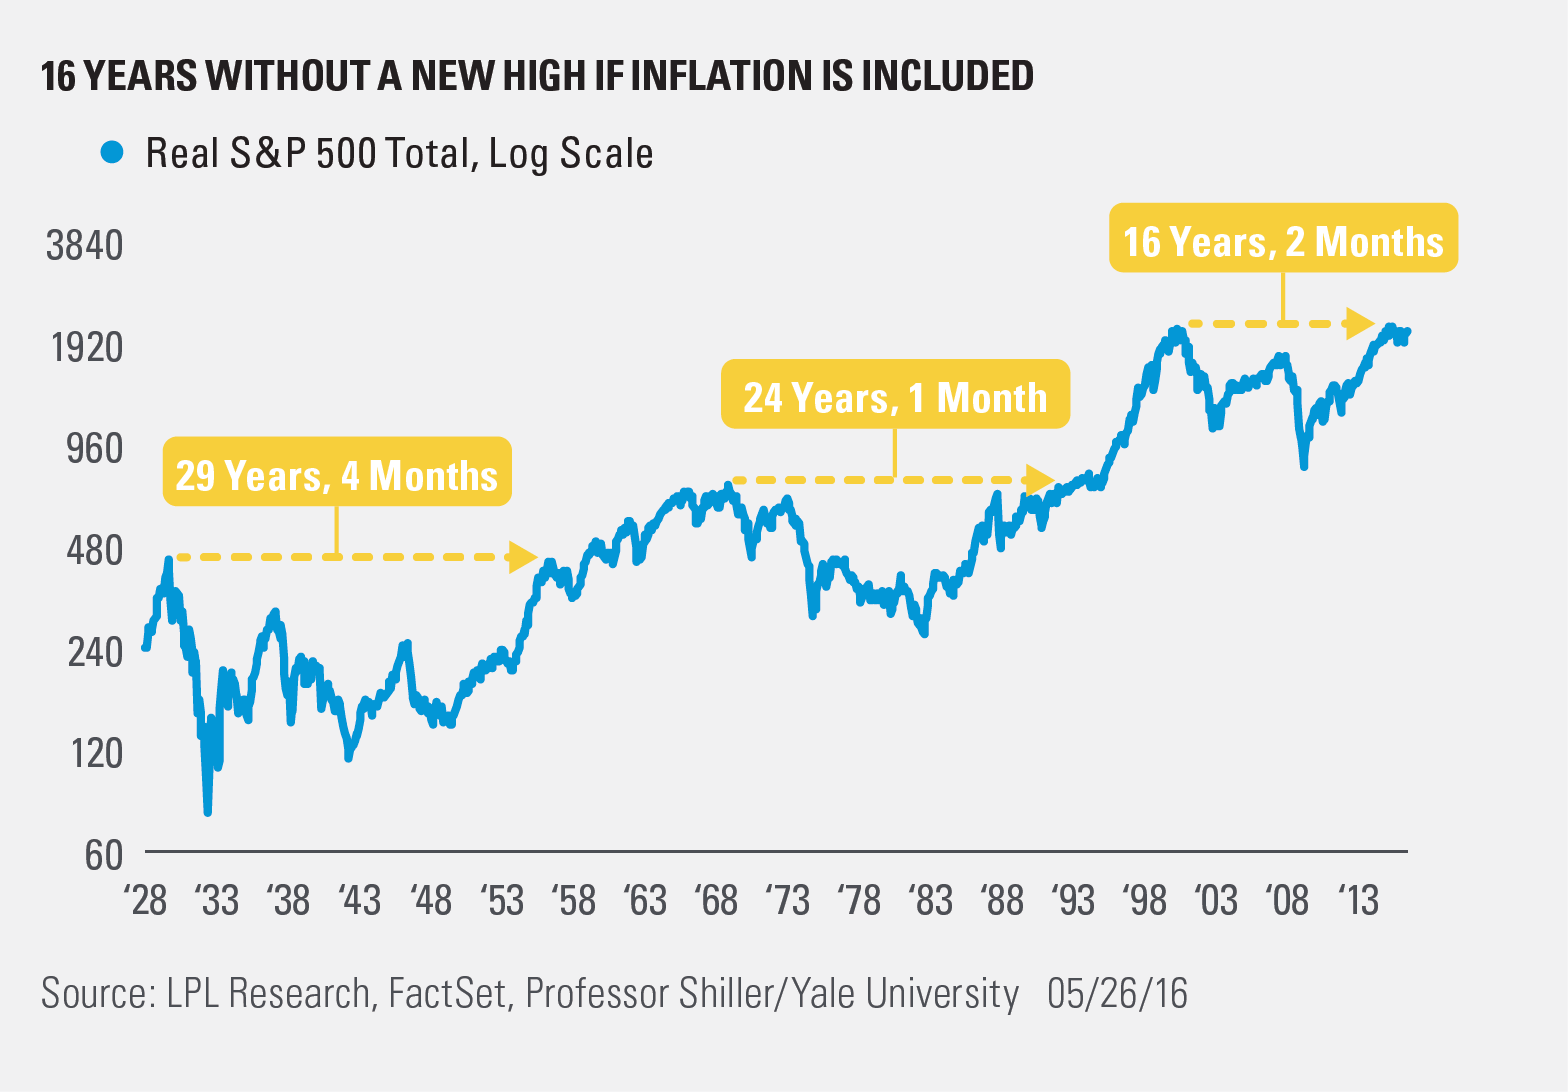
As we noted in our Weekly Market Commentary this week, the S&P 500 has officially gone more than one year without a new all-time closing high. But, did you know that if you adjust for inflation, it has been more than 16 years without a new high?
That’s right, looking at price only is one way to look at price changes, but to factor in inflation potentially shows a more realistic way of what is happening, and that is called the real return. This type of analysis shows the S&P 500 peaked in March 2000 at 2,131. Sixteen years sounds like a long time, but since the 1929 peak in equities, there have been 29- and 24-year streaks without a new high. So, maybe this 16-year streak could have many more years without a true new high?
Here’s the problem with this chart, it only considers inflation and not dividends. As we noted last month, dividends are a great way to juice portfolio returns over the long run. Taking this approach shows the real return on the S&P 500 total return (including dividends) is more than 35% above the 2000 peak! In fact, the S&P 500 is set to close at a new monthly all-time high this month.
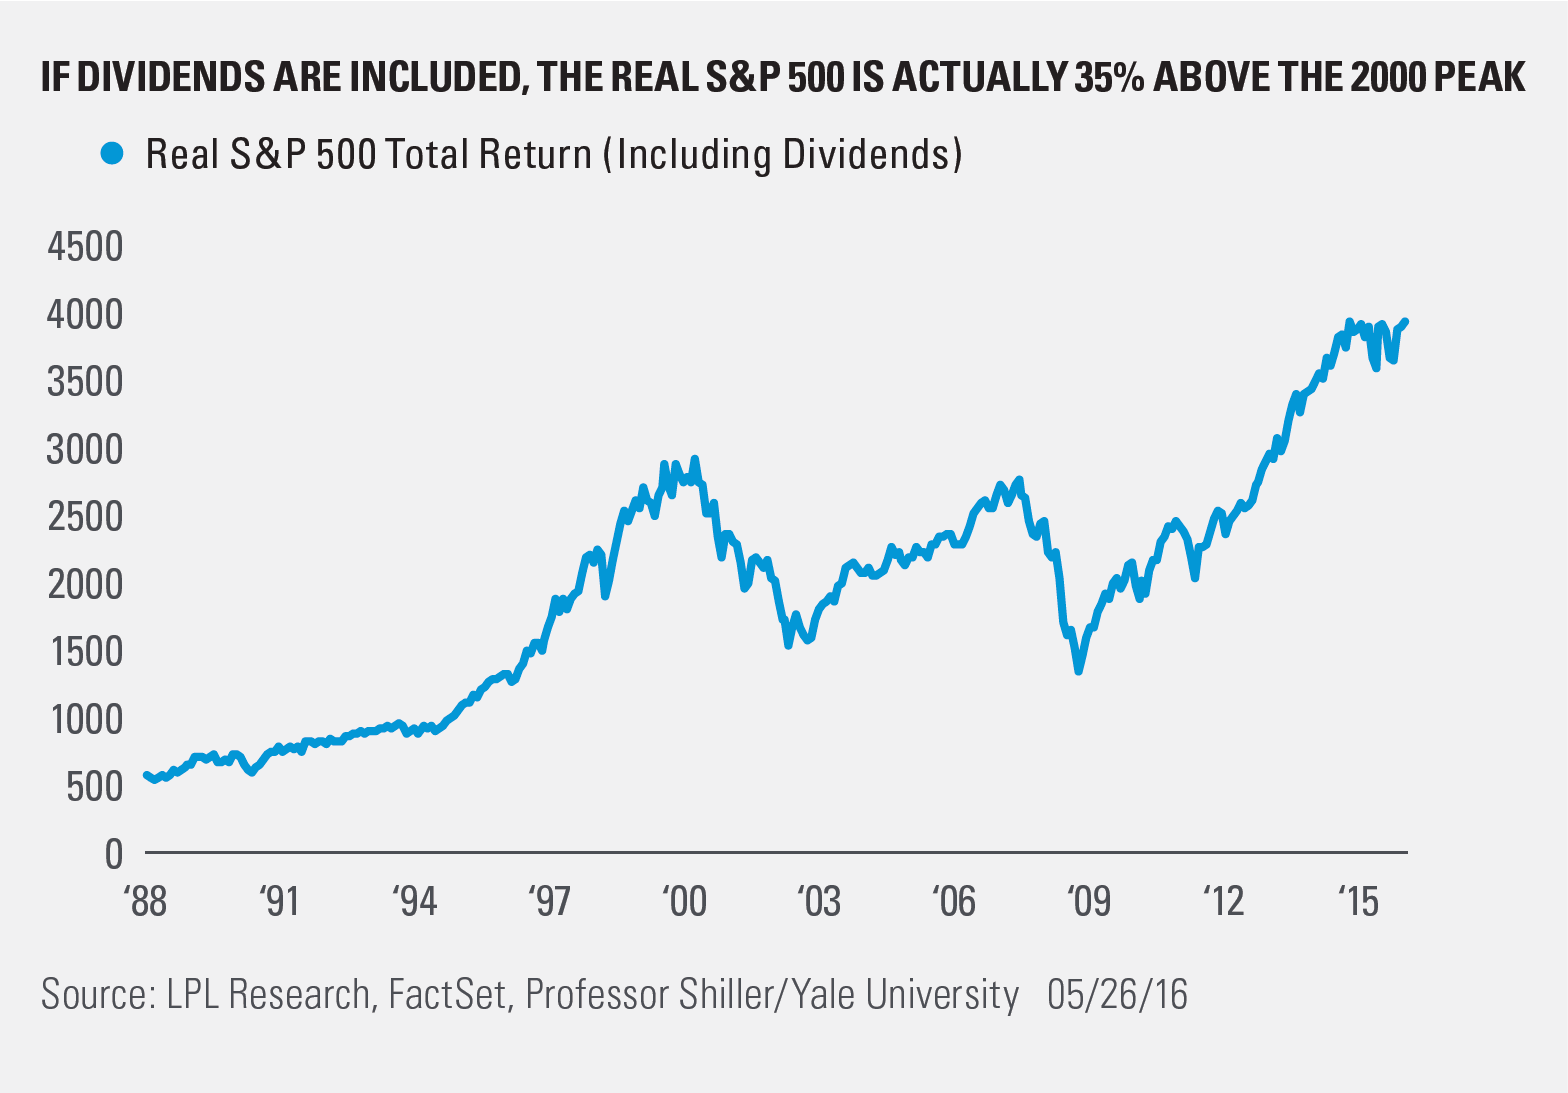
If all you saw was the first chart, you would only be seeing part of the picture. Many have shared a similar chart on social media over the past few weeks and spun it bearishly. But not one included dividends, which gives a much truer view of what has really happened, and paints a much more optimistic picture.
IMPORTANT DISCLOSURES
Past performance is no guarantee of future results. All indexes are unmanaged and cannot be invested into directly. Unmanaged index returns do not reflect fees, expenses, or sales charges. Index performance is not indicative of the performance of any investment.
The economic forecasts set forth in the presentation may not develop as predicted.
The opinions voiced in this material are for general information only and are not intended to provide or be construed as providing specific investment advice or recommendations for any individual security.
Stock investing involves risk including loss of principal.
The S&P 500 Index is a capitalization-weighted index of 500 stocks designed to measure performance of the broad domestic economy through changes in the aggregate market value of 500 stocks representing all major industries.
This research material has been prepared by LPL Financial LLC.
To the extent you are receiving investment advice from a separately registered independent investment advisor, please note that LPL Financial LLC is not an affiliate of and makes no representation with respect to such entity.
Not FDIC/NCUA Insured | Not Bank/Credit Union Guaranteed | May Lose Value | Not Guaranteed by any Government Agency | Not a Bank/Credit Union Deposit
Securities and Advisory services offered through LPL Financial LLC, a Registered Investment Advisor
Member FINRA/SIPC
Tracking #1-501847 (Exp. 05/17)