
One year ago tomorrow the S&P 500 closed at 2130.82, which was also the last time it closed at a new all-time high. Going back to 1955, this is now the 13th time the S&P 500 has gone a full calendar year without a new all-time high. It is worth noting that on a total return basis (including dividends), the S&P 500 did make a new high last month. On a price-only basis the S&P 500 hasn’t reached a new high, which is what we are focusing on here.
Taking a closer look at the data, the longest streak without a new high was during the 1970s and early 1980s at nearly 1,900 trading days. (One calendar year is approximately 252 trading days.) Since 2000 there have been two vicious bear markets, and both times saw streaks of more than 1,000 trading days without new highs. The flip side is 1994–1995 went 259 days (so just over one calendar year) without a new high and 1983–1984 saw a period of slightly more than a year without a new high. Be aware that both of those year-long consolidations took place in the midst of longer-term bull markets.
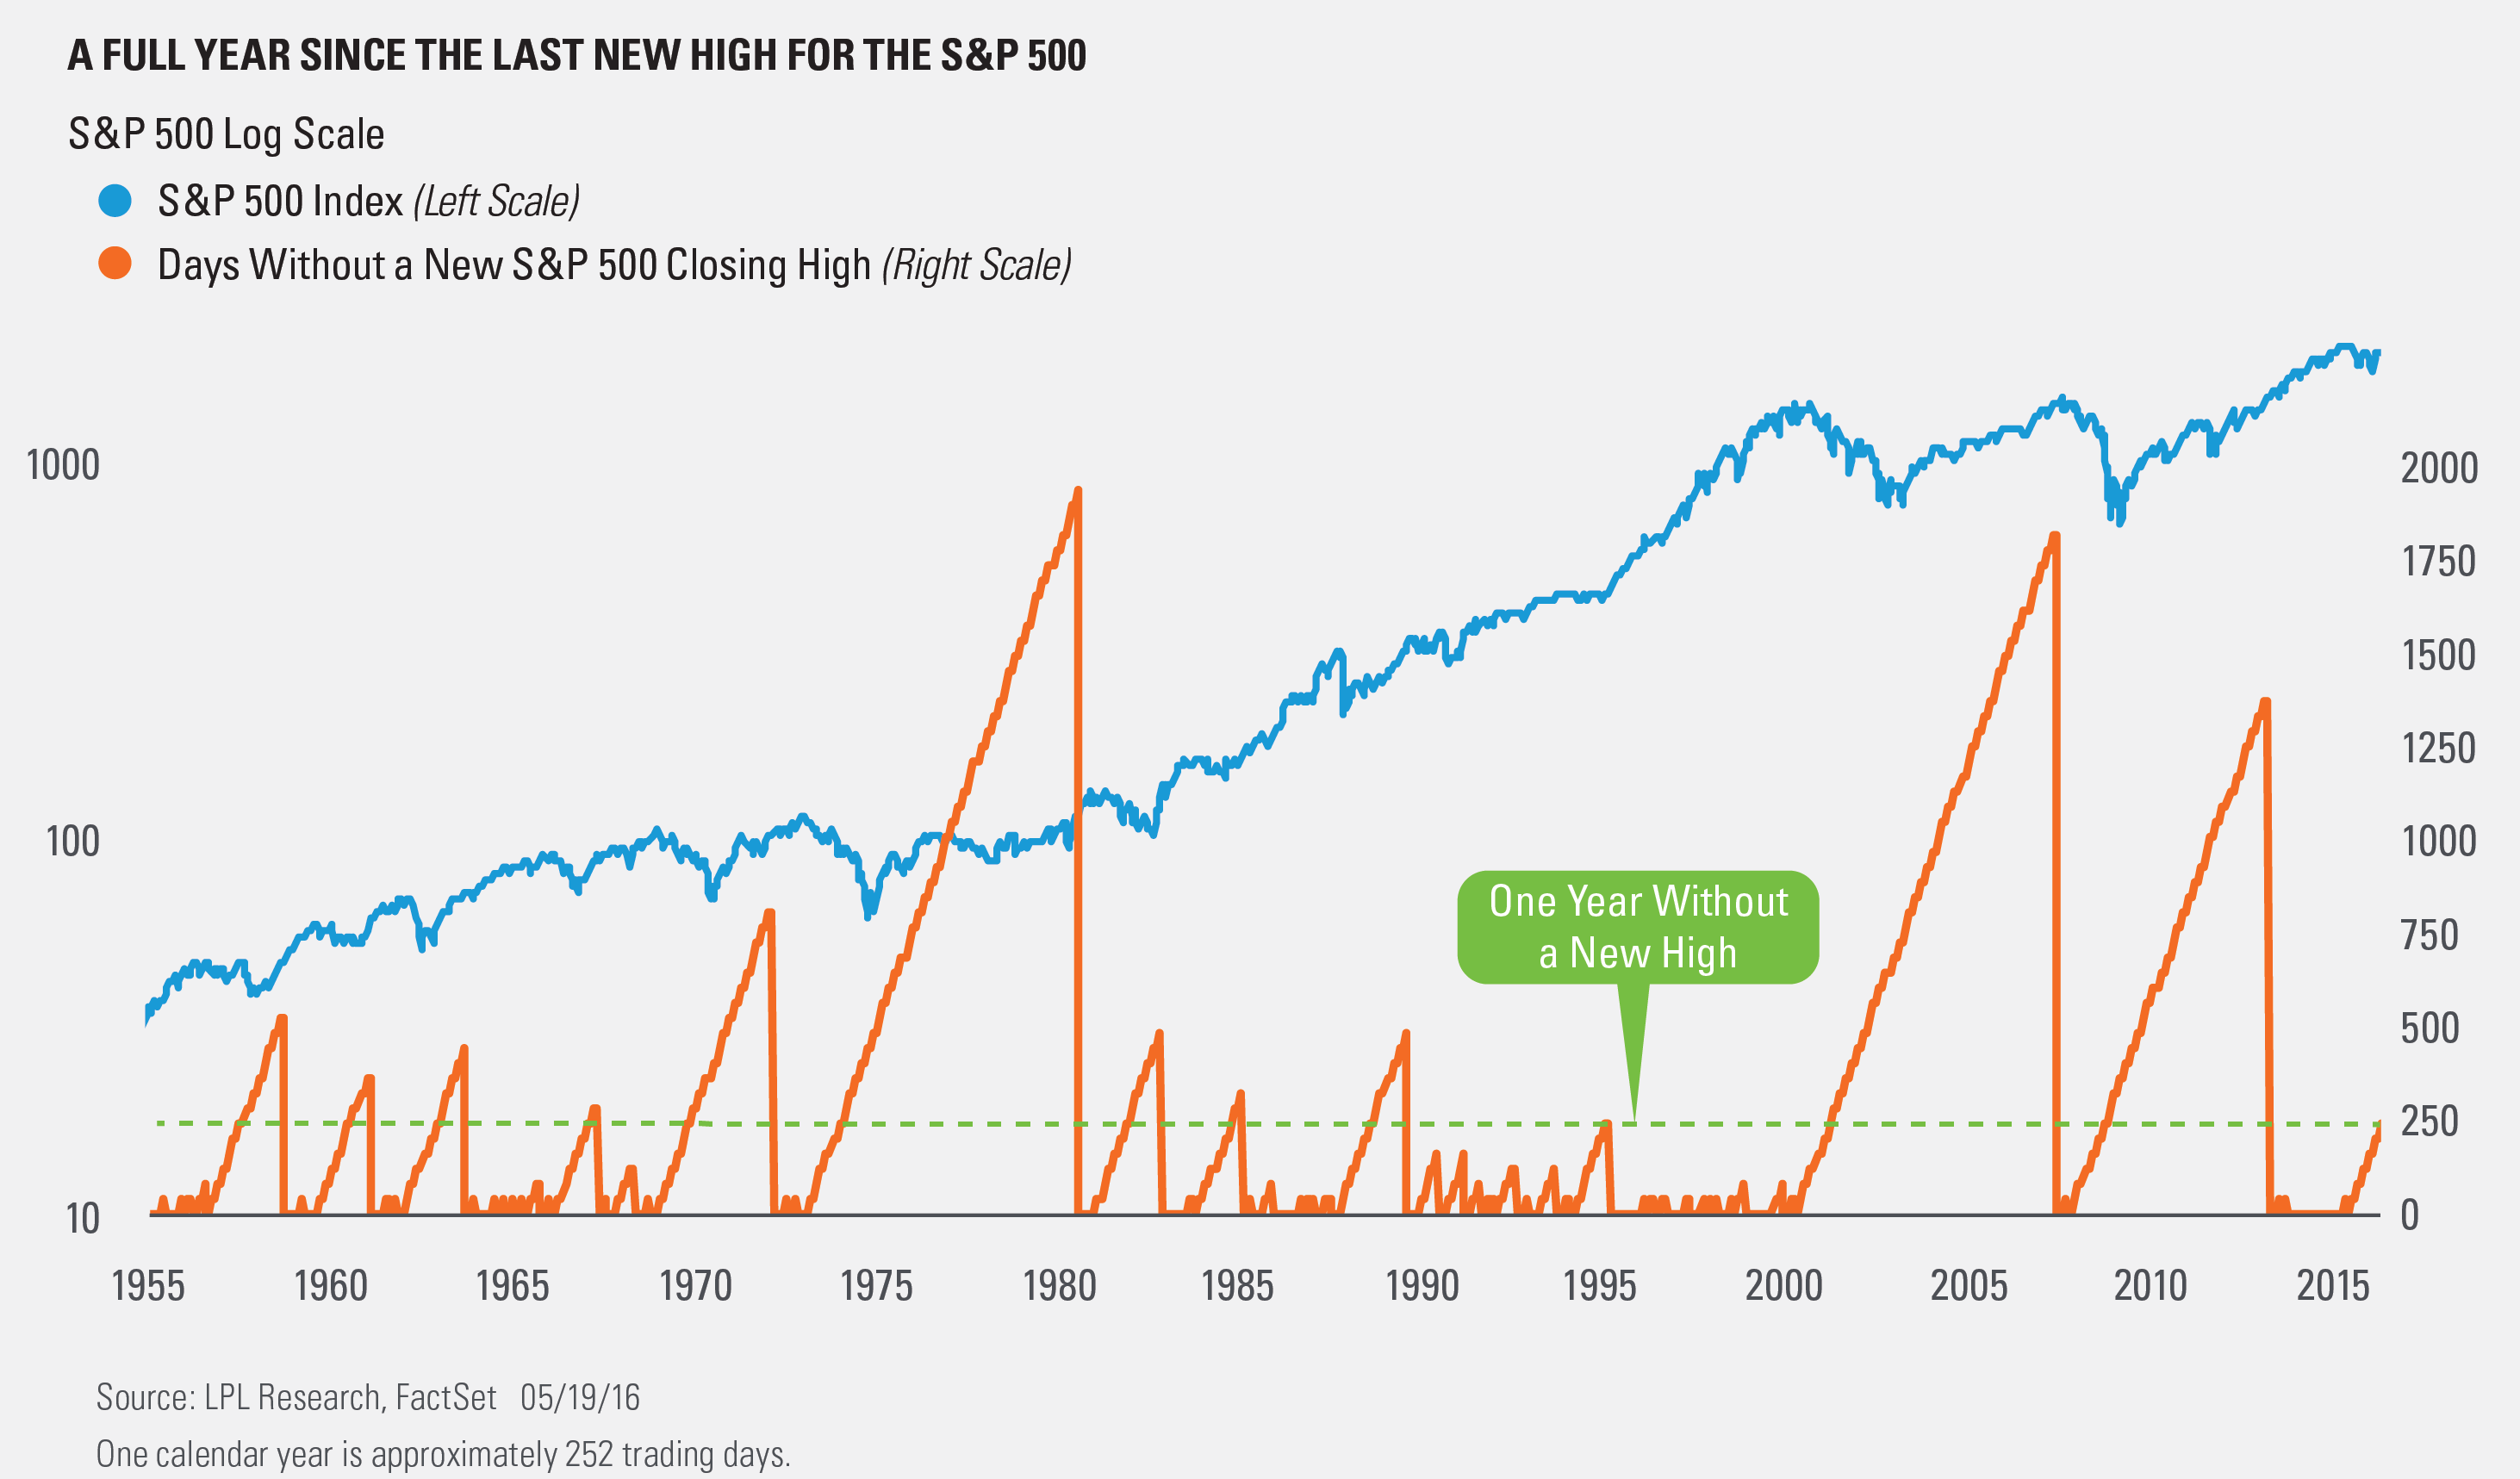
So although it has been a long time since the last new high, it is possible that a year consolidation without a new high can happen before a resumption of the bull market. We will have much more on this important development in next week’s Weekly Market Commentary.
IMPORTANT DISCLOSURES
Past performance is no guarantee of future results. All indexes are unmanaged and cannot be invested into directly.
Unmanaged index returns do not reflect fees, expenses, or sales charges. Index performance is not indicative of the performance of any investment.
The economic forecasts set forth in the presentation may not develop as predicted.
The opinions voiced in this material are for general information only and are not intended to provide or be construed as providing specific investment advice or recommendations for any individual security.
Stock investing involves risk including loss of principal.
The S&P 500 Index is a capitalization-weighted index of 500 stocks designed to measure performance of the broad domestic economy through changes in the aggregate market value of 500 stocks representing all major industries.
This research material has been prepared by LPL Financial LLC.
To the extent you are receiving investment advice from a separately registered independent investment advisor, please note that LPL Financial LLC is not an affiliate of and makes no representation with respect to such entity.
Not FDIC/NCUA Insured | Not Bank/Credit Union Guaranteed | May Lose Value | Not Guaranteed by any Government Agency | Not a Bank/Credit Union Deposit
Securities and Advisory services offered through LPL Financial LLC, a Registered Investment Advisor
Member FINRA/SIPC
Tracking #1-499786 (Exp. 05/17)