Crude oil is in the news again today, with Saudi Arabia replacing its long-time oil minister, and thus, potentially signaling a change in maintaining its high production. Also, wildfires in Canada are disrupting output by nearly a million barrels a day in the energy-rich country. Rain is needed to slow things down and allow officials to figure out the exact damage from this fire; as of now, there is no rain coming until the weekend.
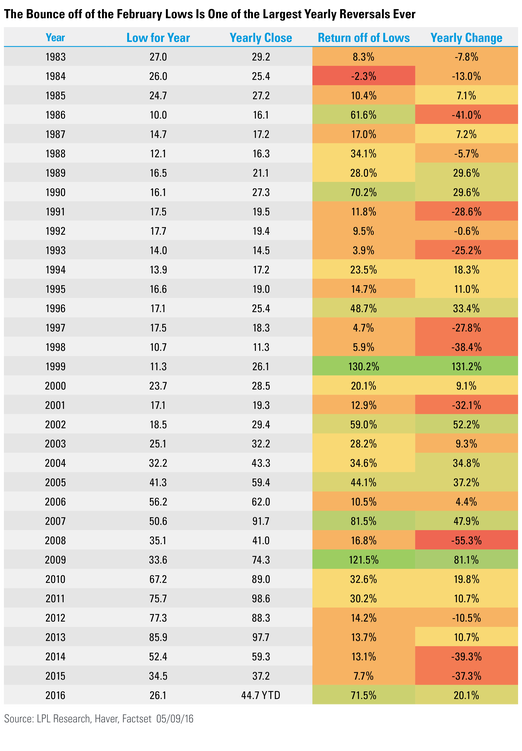
On February 17 we noted that crude oil was in the midst of its longest bear market and the furthest below its 200-day moving average (going back to 1983). In other words, it was ripe for a potential bounce on any good news. Sure enough, crude has seen a historic bounce over the past three months. In fact, crude oil is currently more than 70% above its February lows; and as of the end of April, it was up nearly 76% above those yearly lows.
Coming into this year, crude oil had two of its worst years back-to-back since 1997 and 1998. In 1999, crude oil bounced 131% as a result. So far this year, crude oil is up 20%, which is a significant comeback from when it was down 30% at its February lows. In fact, crude oil hasn’t been down three years in a row for more than 30 years.
The chart below shows how far crude oil has bounced each year off of its yearly lows, along with its yearly change. The 71.5% bounce off of the yearly lows currently ranks as the fourth-largest move off the lows going back to 1983, with only 1999, 2007, and 2009 higher. Of course, with more than half of the year to go, there is still plenty of time for this to change.
IMPORTANT DISCLOSURES
Past performance is no guarantee of future results. All indexes are unmanaged and cannot be invested into directly. Unmanaged index returns do not reflect fees, expenses, or sales charges. Index performance is not indicative of the performance of any investment.
The economic forecasts set forth in the presentation may not develop as predicted.
The opinions voiced in this material are for general information only and are not intended to provide or be construed as providing specific investment advice or recommendations for any individual security.
Stock investing involves risk including loss of principal.
Commodity-linked investments may be more volatile and less liquid than the underlying instruments or measures, and their value may be affected by the performance of the overall commodities baskets as well as weather, geopolitical events, and regulatory developments.
The S&P 500 Index is a capitalization-weighted index of 500 stocks designed to measure performance of the broad domestic economy through changes in the aggregate market value of 500 stocks representing all major industries.
This research material has been prepared by LPL Financial LLC.
To the extent you are receiving investment advice from a separately registered independent investment advisor, please note that LPL Financial LLC is not an affiliate of and makes no representation with respect to such entity.
Not FDIC/NCUA Insured | Not Bank/Credit Union Guaranteed | May Lose Value | Not Guaranteed by any Government Agency | Not a Bank/Credit Union Deposit
Securities and Advisory services offered through LPL Financial LLC, a Registered Investment Advisor
Member FINRA/SIPC
Tracking # 1-495754 (Exp. 05/17)