
With May right around the corner, it is time to start talking about the adage, “sell in May and go away.” We will talk in detail about this in next week’s Weekly Market Commentary, but today we’ll take a brief look.
First, this theory is simply to sell stocks ahead of the seasonally weak May to October period. Going back to 1950, the May to October period for the S&P 500 has averaged a return of +1.4% and been higher 62% of the time. Compare that with the usually strong November to April period, with an average gain of 7.1% and higher 77% of the time.
When looking at the past 10 years, what’s particularly interesting is that the S&P 500 virtually peaks right at the start of May, before the usual volatility and consolidation during the summer months. In fact, as of April 30, the S&P 500 is up 4.2% year to date, on average, over the past 10 years; by the end of October, it is up to 5.2%.
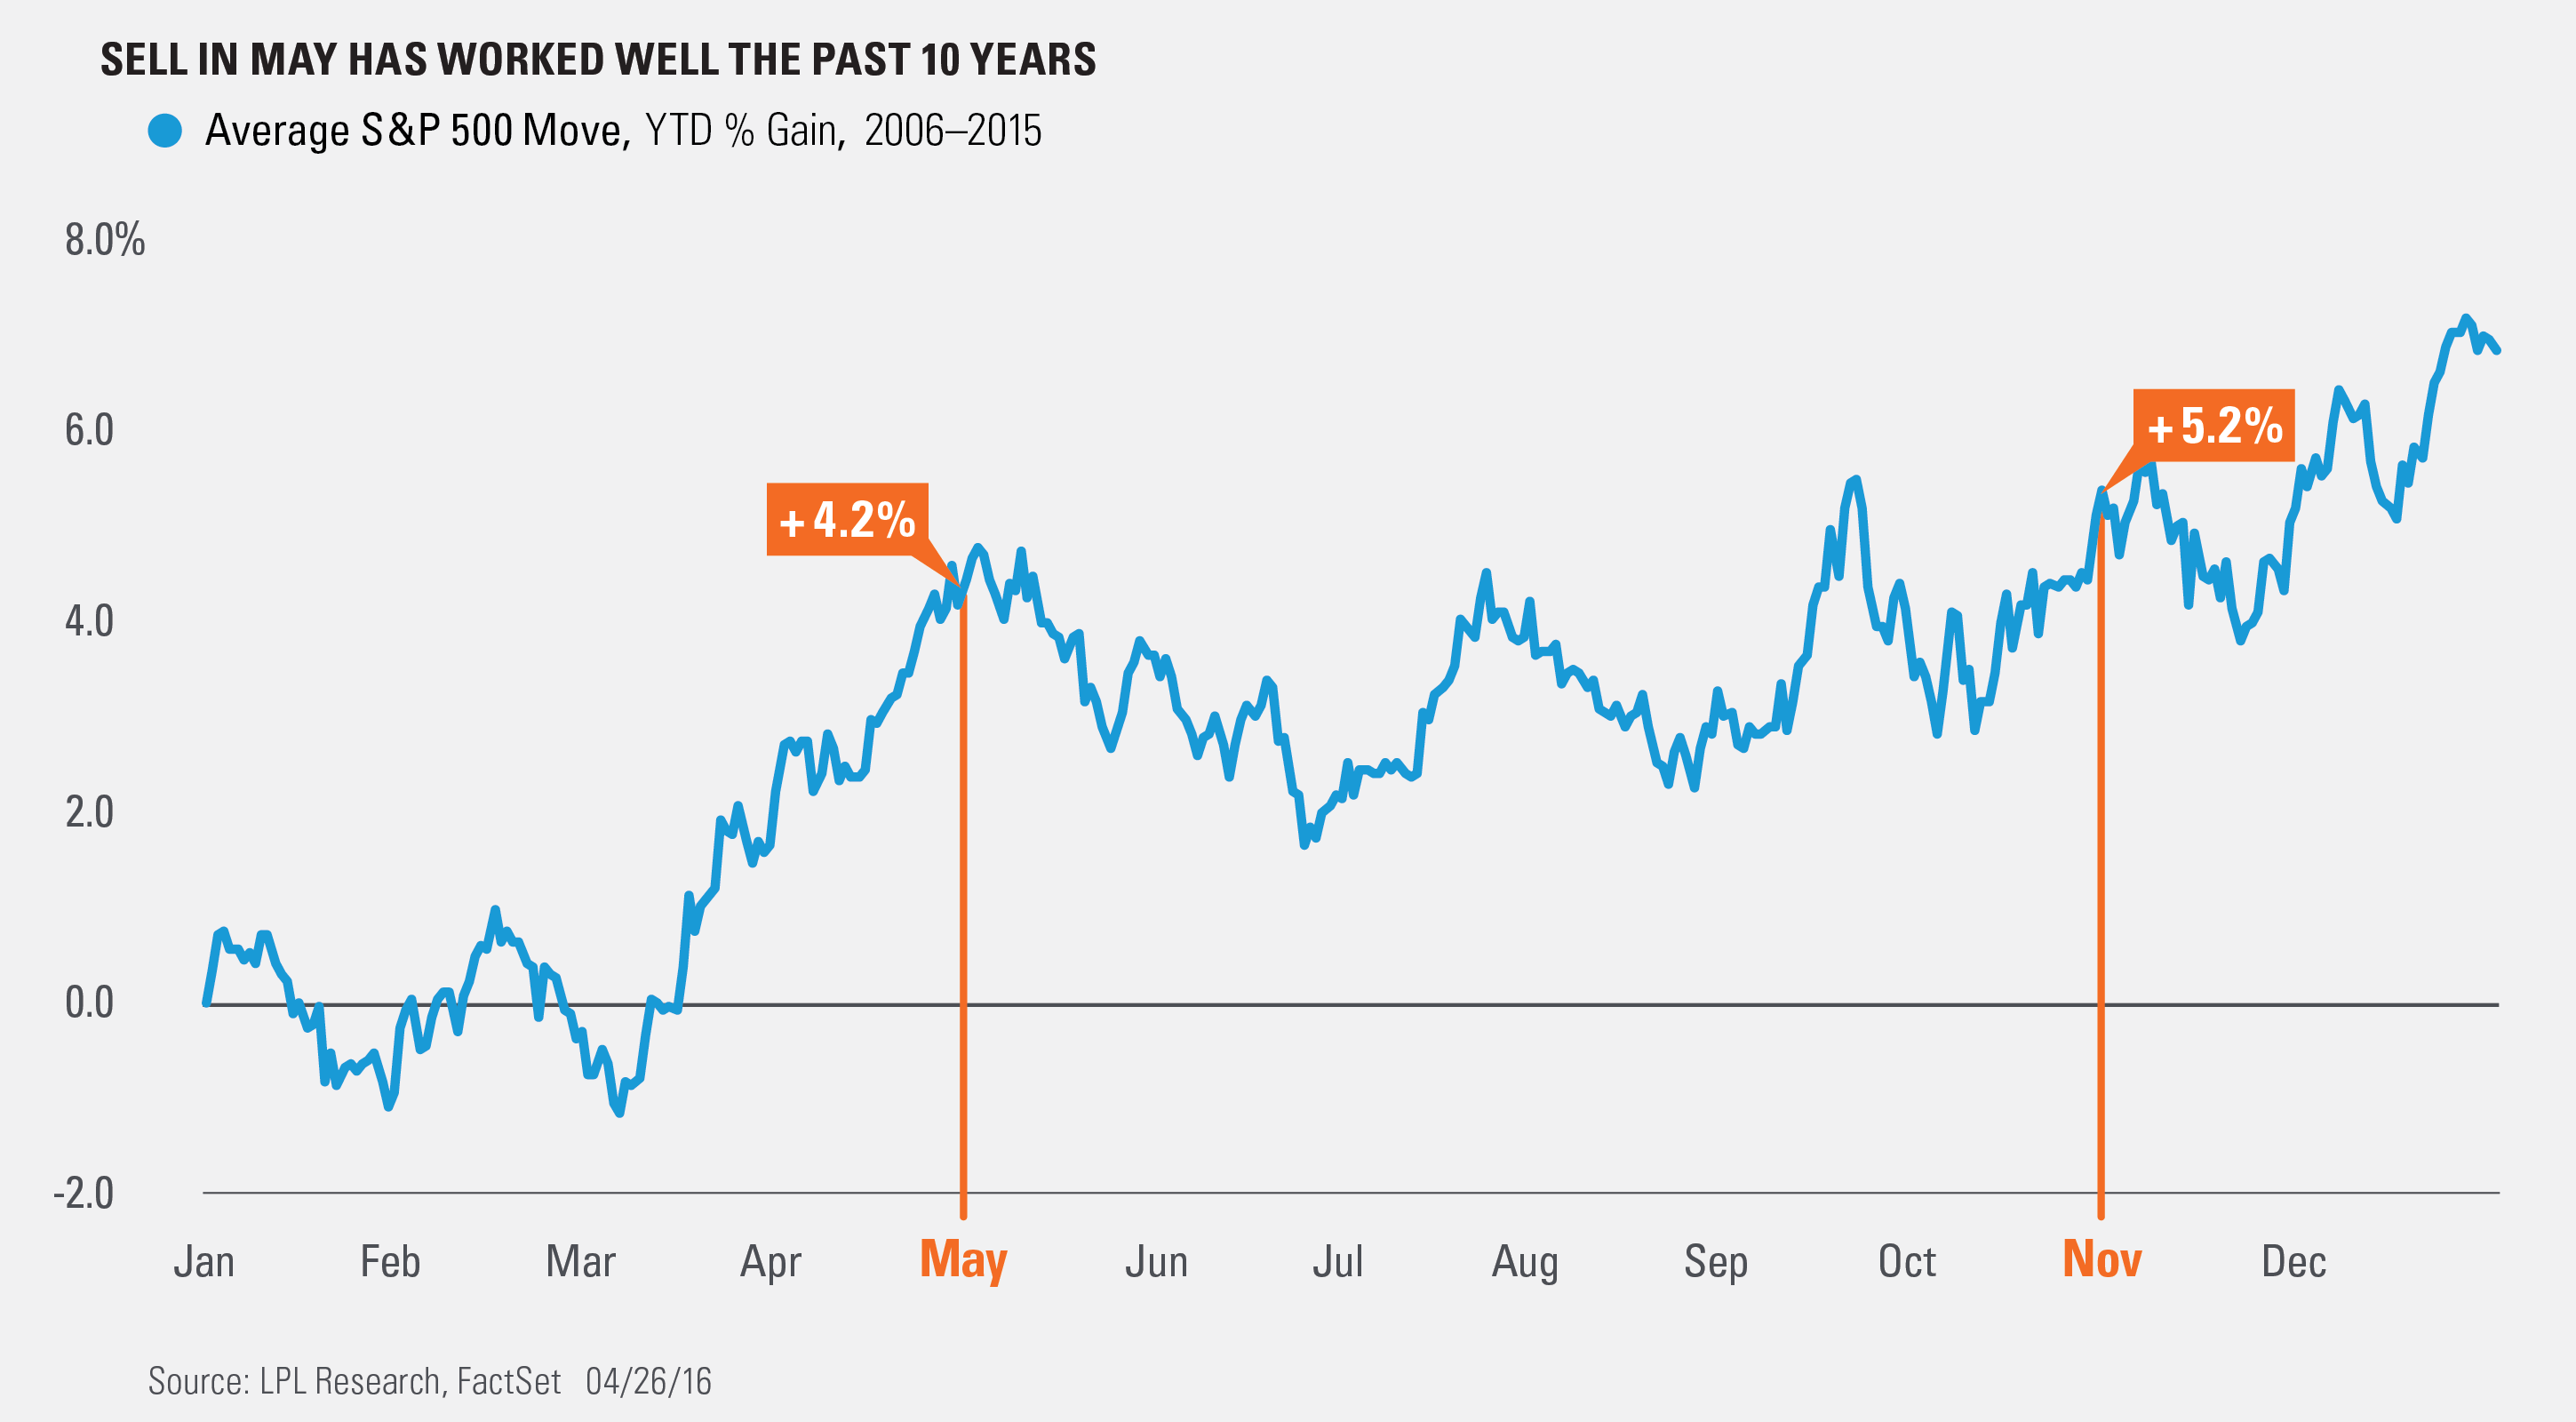
During the historically weaker six months, the S&P 500 has gained 1% in the past 10 years. Considering that for the full year, the S&P 500 has gained an average of 6.9% in those past 10 years, you can conclude that the gains tend to happen during the other six months. Be on the lookout for next week’s more in-depth look at this phenomenon in our upcoming Weekly Market Commentary.
IMPORTANT DISCLOSURES
Past performance is no guarantee of future results. All indexes are unmanaged and cannot be invested into directly.
Unmanaged index returns do not reflect fees, expenses, or sales charges. Index performance is not indicative of the performance of any investment.
The economic forecasts set forth in the presentation may not develop as predicted.
The opinions voiced in this material are for general information only and are not intended to provide or be construed as providing specific investment advice or recommendations for any individual security.
Stock investing involves risk including loss of principal.
The S&P 500 Index is a capitalization-weighted index of 500 stocks designed to measure performance of the broad domestic economy through changes in the aggregate market value of 500 stocks representing all major industries.
This research material has been prepared by LPL Financial LLC.
To the extent you are receiving investment advice from a separately registered independent investment advisor, please note that LPL Financial LLC is not an affiliate of and makes no representation with respect to such entity.
Not FDIC/NCUA Insured | Not Bank/Credit Union Guaranteed | May Lose Value | Not Guaranteed by any Government Agency | Not a Bank/Credit Union Deposit
Securities and Advisory services offered through LPL Financial LLC, a Registered Investment Advisor
Member FINRA/SIPC
Tracking # 1-492498 (Exp. 04/17)