
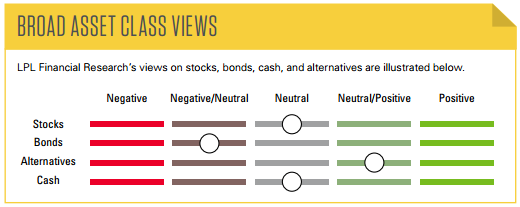
COMPASS CHANGES
- Upgraded emerging markets to neutral from negative/neutral.
Click here to download a PDF of this report.
INVESTMENT TAKEAWAYS
- We continue to expect modest stock market gains in 2016,* led by U.S. large caps.
- We are taking a more balanced sector approach as the business cycle ages, but continue to favor growth over value.
- Recent technical strength on top of attractive valuations, favorable demographics, and progress in addressing oil’s supply-demand imbalances suggest improving prospects for emerging markets.
- Municipal bonds remain an attractive high-quality bond option as valuations have cheapened recently, supply-demand balance improves, and local taxes possibly increase.
- High-yield bonds are likely near fair value after oil gains helped to compress spreads, but yields may still be attractive in a low-return environment.
- A gradual pace of Federal Reserve (Fed) rate hikes, dollar stability, and global macroeconomic and policy risk are good for precious metals in the near term.
- From a technical perspective, if the S&P 500 sustains a price above its 200-day simple moving average at 2014, the likelihood increases that the intermediate-term downtrend will be reversed.
*Historically since WWII, the average annual gain on stocks has been 7–9%. Thus, our forecast is roughly in-line with average stock market growth. We forecast a mid-single-digit gain, including dividends, for U.S. stocks in 2016 as measured by the S&P 500. This gain is derived from earnings per share (EPS) for S&P 500 companies assuming mid- to high-single-digit earnings gains, and a largely stable price-to-earnings ratio (PE). Earnings gains are supported by our expectation of improved global economic growth and stable profit margins in 2016
MACROECONOMIC VIEWS
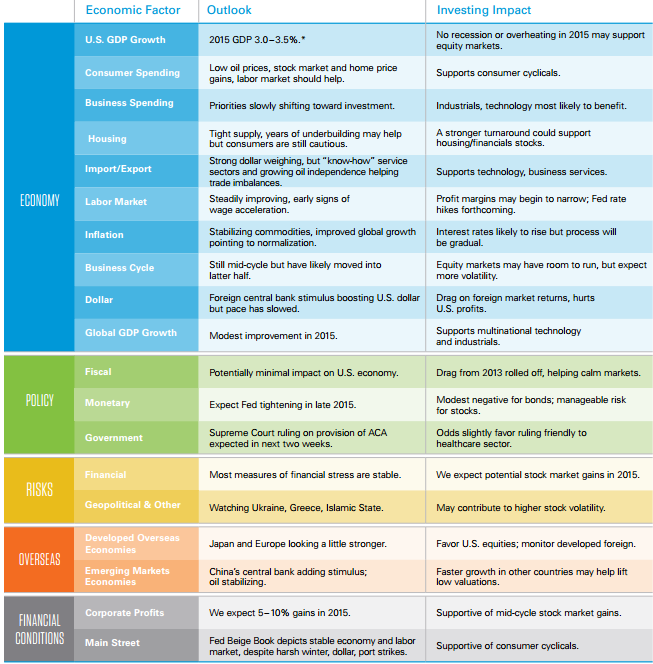
Source: LPL Research, U.S. Department of Energy, Haver Analytics 02/16/16
*Our forecast for GDP growth of between 2.5 –3% is based on the historical mid-cycle growth rate of the last 50 years. Economic growth is affected by changes to inputs such as: business and consumer spending, housing, net exports, capital investments, and government spending.
The opinions voiced in this material are for general information only and are not intended to provide or be construed as providing specific investment advice or recommendations for your clients. Any economic forecasts set forth in the presentation may not develop as predicted and there can be no guarantee that strategies promoted will be successful.
WHAT WE’RE WATCHING
The Cycle Clock suggests we are in the mid-to-late stage of the current expansion, but we are still seeing some early cycle and late cycle behavior. Extended loose monetary policy, inflation, and employment growth are still exhibiting early cycle behavior, while some items relating to corporate profits are showing late cycle behavior, although they may be reset if profits improve.
“What We’re Watching” features indicators that are keys to the current LPL Research macroeconomic outlook. Economic and market dynamics will dictate featured topics and their durability

Sources: LPL Research, Federal Reserve, U.S. Bureau of Economic Analysis (BEA), U.S. Bureau of Labor Statistics, U.S. Bureau of the Census, Standard and Poor’s, Robert Shiller, National Bureau of Economic Research, Haver Analytics 02/16/16
Data for all series are as of February 16, 2016. Starting point for all series is June 1954 except housing starts (March 1961), hourly earnings (December 1970), and commodity prices (December 1970). Real prices and real earnings determined using the Consumer Price Index for all urban consumers (CPI-U). Commodity prices are based on the GSCI Total Return Index. Profitability is based on real profit per unit value added for non-financial corporate business based on current production as calculated by the BEA.
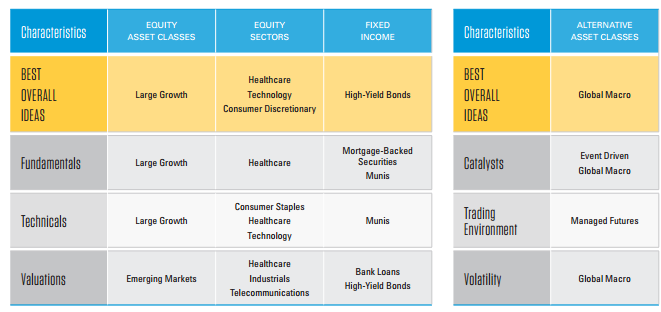
ASSET CLASS & SECTOR TOP PICKS
Below we provide our top overall ideas across the various asset classes and sectors covered in this publication, as well as our best ideas within the three disciplines of our investment process: fundamentals, technicals, and valuations. More details on these and other investment ideas can be found in subsequent pages.
EQUITY ASSET CLASSES
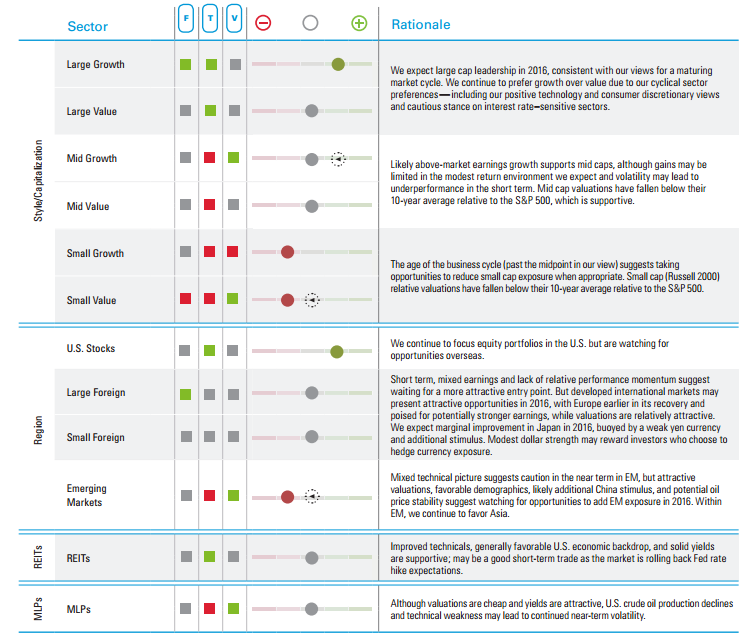
In 2016, we expect mid-single-digit returns with large cap and growth leadership, as discussed in our Outlook 2016: Embrace the Routine publication. Due to the age of the business cycle and weakening technical analysis indicators, we have turned more cautious on small cap stocks. We recommend investors focus allocations in the U.S., but are watching for potential opportunities overseas where valuations are relatively more attractive and further stimulus efforts may boost performance.
Investing in real estate/REITs involves special risks such as potential illiquidity and may not be suitable for all investors. There is no assurance that the investment objectives of this program will be attained.
Investing in MLPs involves additional risks as compared with the risks of investing in common stock, including risks related to cash flow, dilution, and voting rights. MLPs may trade less frequently than larger companies due to their smaller capitalizations, which may result in erratic price movement or difficulty in buying or selling. MLPs are subject to significant regulation and may be adversely affected by changes in the regulatory environment, including the risk that an MLP could lose its tax status as a partnership. Additional management fees and other expenses are associated with investing in MLP funds.
EQUITY SECTORS
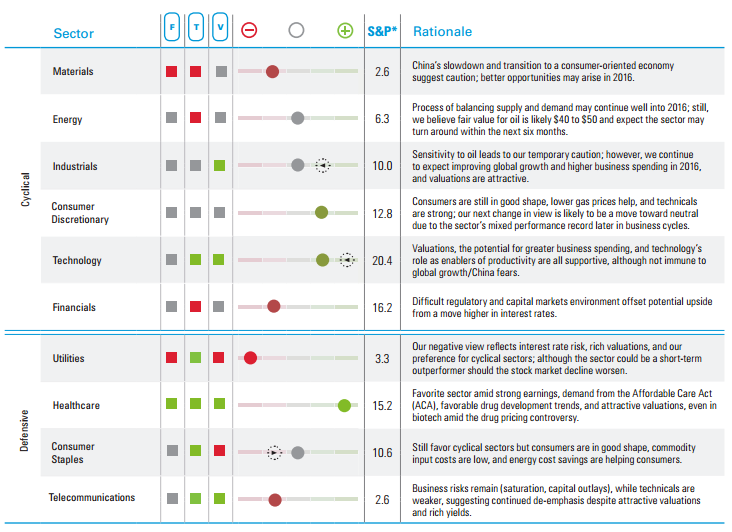
We continue to favor healthcare and cyclical growth sectors, including technology, as the economic expansion continues, but generally favor more benchmark-like positioning in the near term. As the bull market ages, we have become less positive on consumer discretionary despite the continued benefit from low gas prices. Strong technicals, rich yields, and in the case of telecom, low valuations, support less negative tactical views on telecom and utilities. The slow supply response to lower oil prices and technical weakness keep us cautious on energy, while our temporary caution on industrials reflects the sector’s sensitivity to oil prices.
Because of its narrow focus, specialty sector investing, such as healthcare, financials, or energy, will be subject to greater volatility than investing more broadly across many sectors and companies.
There is no guarantee that a diversified portfolio will enhance overall returns or outperform a nondiversified portfolio. Diversification does not ensure against market risk.
FIXED INCOME
Municipal bonds have begun 2016 on a strong note even if lagging Treasuries during recent high-quality bond strength. Valuations remain elevated but a favorable supply-demand balance and prospects for higher (local) taxes should provide support in 2016. Municipal bonds’ credit quality remains generally good; problem issuers remain isolated and have not impacted the broader market.
Yield spread is the difference between yields on differing debt instruments, calculated by deducting the yield of one instrument from another. The higher the yield spread, the greater the difference between the yields offered by each instrument. The spread can be measured between debt instruments of differing maturities, credit ratings, and risk.
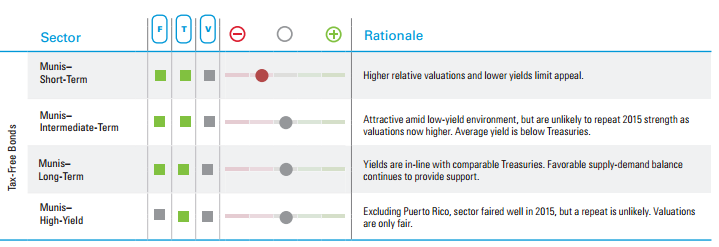
For the purposes of this publication, intermediate-term bonds have maturities between 3 and 10 years, and short-term bonds are those with maturities of less than 3 years.
All bonds are subject to market and interest rate risk if sold prior to maturity. Bond values will decline as interest rates rise and are subject to availably and change in price.
High-yield/junk bonds are not investment-grade securities, involve substantial risks, and generally should be part of the diversified portfolio of sophisticated investors.
Municipal interest income may be subject to the alternative minimum tax. Federally tax-free but other state and local taxes may apply.
Corporate bonds are considered higher risk than government bonds but normally offer a higher yield and are subject to market, interest rate, and credit risk, as well as additional risks based on the quality of issuer coupon rate, price, yield, maturity, and redemption features.
FIXED INCOME (CONTINUED)
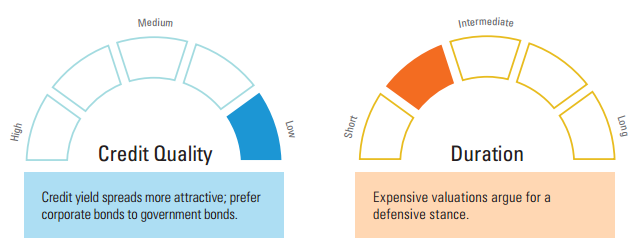
A low-return environment is likely to persist despite a strong start to 2016 on safe-haven buying. Still, current stock market volatility illustrates how high-quality bonds still play a role in portfolios. High-yield bonds have endured the worst stretch since August 2011 and the peak of European debt fears. While we believe high-yield bonds represent value with an average yield spread of 8%, a bottom remains elusive as risk aversion remains high. In general, we find default expectations among energy companies—and the overall high-yield market—too pessimistic, and a “coupon clipping” environment may still aid investors. For fixed income allocations, we emphasize a blend of high-quality intermediate bonds coupled with less interest rate–sensitive sectors such as high-yield bonds and bank loans for suitable investors.
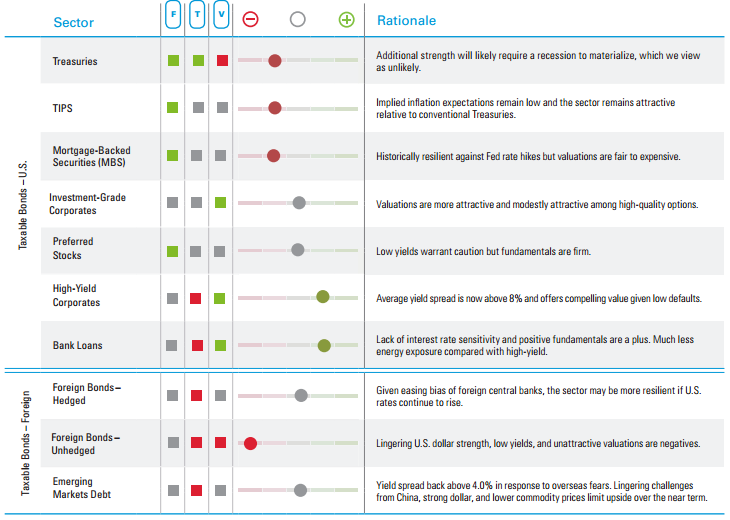
Investing in foreign and emerging markets debt securities involves special additional risks. These risks include, but are not limited to, currency risk, geopolitical and regulatory risk, and risk associated with varying settlement standards.
Mortgage-backed securities are subject to credit, default, prepayment risk that acts much like call risk when you get your principal back sooner than the stated maturity, extension risk, the opposite of prepayment risk, market and interest rate risk.
Bank loans are loans issued by below investment-grade companies for short-term funding purposes with higher yield than short-term debt and involve risk.
Treasury Inflation-Protected Securities (TIPS) help eliminate inflation risk to your portfolio, as the principal is adjusted semiannually for inflation based on the Consumer Price Index (CPI)—while providing a real rate of return guaranteed by the U.S. government. Investing in foreign and emerging markets debt securities involves special additional risks. These risks include, but are not limited to, currency risk, geopolitical, and regulatory risk, and risk associated with varying settlement standards.
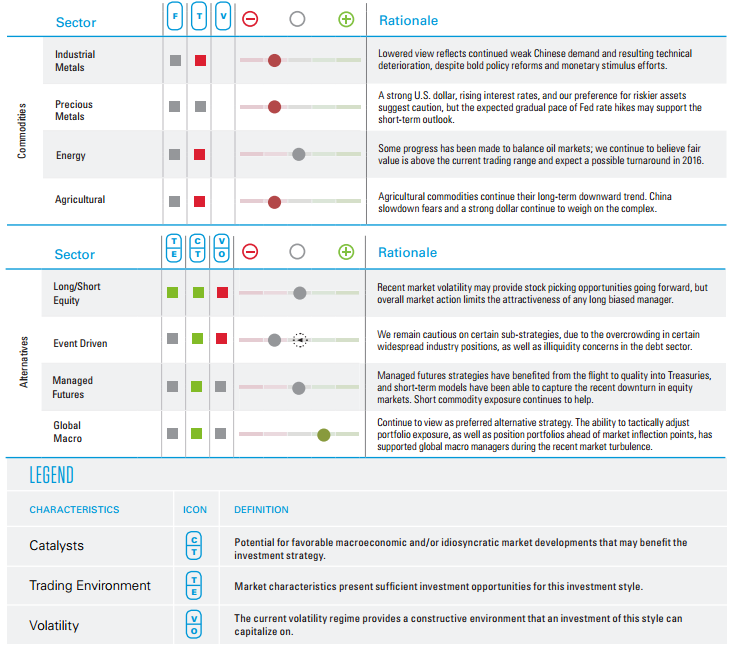
COMMODITIES & ALTERNATIVE ASSET CLASSES
U.S. dollar strength and concerns regarding the health of the Chinese economy have us remaining cautious the broad commodities market. We believe that oil prices will rise, as the current market price is too low to meet all associated costs. However, given that these decisions are as much political as economic, it is difficult to ascertain the timing of an oil rebound. Divergent central bank policy may lead to higher market volatility and more asset dispersion, creating a more fertile environment for macro strategies. Highly directional strategies, either in credit or equities, have fared the worst.
Alternative strategies may not be suitable for all investors and should be considered as an investment for the risk capital portion of the investor’s portfolio. The strategies employed in the management of alternative investments may accelerate the velocity of potential losses.
Commodity-linked investments may be more volatile and less liquid than the underlying instruments or measures, and their value may be affected by the performance of the overall commodities baskets as well as weather, geopolitical events, and regulatory developments.
IMPORTANT DISCLOSURES
All performance referenced is historical and is no guarantee of future results.
There is no assurance that the techniques and strategies discussed are suitable for all investors or will yield positive outcomes. The purchase of certain securities may be required to affect some of the strategies.
Stock and Pooled Investment Risks
Investing in stock includes numerous specific risks including: the fluctuation of dividend, loss of principal and potential illiquidity of the investment in a falling market. Investing in foreign and emerging markets securities involves special additional risks. These risks include, but are not limited to, currency risk, geopolitical risk, and risk associated with varying accounting standards. Investing in emerging markets may accentuate these risks.
Bond and Debt Equity Risks
Bonds are subject to market and interest rate risk if sold prior to maturity. Bond and bond mutual fund values and yields will decline as interest rates rise and bonds are subject to availability and change in price.
Government bonds and Treasury bills are guaranteed by the U.S. government as to the timely payment of principal and interest and, if held to maturity, offer a fixed rate of return and fixed principal value. However, the value of fund shares is not guaranteed and will fluctuate.
Alternative Risks
Currency risk is a form of risk that arises from the change in price of one currency against another. Whenever investors or companies have assets or business operations across national borders, they face currency risk if their positions are not hedged.
Long/short equity strategies are subject to normal alternative investment risks, including potentially higher fees; while there is additional management risk, as the manager is attempting to accurately anticipate the likely movement of both their long and short holdings. There is also the risk of “beta-mismatch,” in which long positions could lose more than short positions during falling markets.
Event driven strategies, such as merger arbitrage, consist of buying shares of the target company in a proposed merger and fully or partially hedging the exposure to the acquirer by shorting the stock of the acquiring company or other means. This strategy involves significant risk as events may not occur as planned and disruptions to a planned merger may result in significant loss to a hedged position.
Managed futures strategies use systematic quantitative programs to find and invest in positive and negative trends in the futures markets for financials and commodities. Futures and forward trading is speculative, includes a high degree of risk that the anticipated market outcome may not occur, and may not be suitable for all investors.
DEFINITIONS
The Simple Moving Average is an arithmetic moving average that is calculated by adding the closing price of the security for a number of time periods and then dividing this total by the number of time periods. Short-term averages respond quickly to changes in the price of the underlying, while long-term averages are slow to react.
The Beige Book is a commonly used name for the Federal Reserve’s (Fed) report called the Summary of Commentary on Current Economic Conditions by Federal Reserve District. It is published just before the Federal Open Market Committee (FOMC) meeting on interest rates and is used to inform the members on changes in the economy since the last meeting.
Quantitative Easing (QE) refers to the Federal Reserve’s (Fed) current and/or past programs whereby the Fed purchases a set amount of Treasury and/or Mortgage-Backed securities each month from banks. This inserts more money in the economy (known as easing), which is intended to encourage economic growth.
Technical Analysis is a methodology for evaluating securities based on statistics generated by market activity, such as past prices, volume and momentum, and is not intended to be used as the sole mechanism for trading decisions. Technical analysts do not attempt to measure a security’s intrinsic value, but instead use charts and other tools to identify patterns and trends. Technical analysis carries inherent risk, chief amongst which is that past performance is not indicative of future results. Technical Analysis should be used in conjunction with Fundamental Analysis within the decision making process and shall include but not be limited to the following considerations: investment thesis, suitability, expected time horizon, and operational factors, such as trading costs are examples.
INDEX DEFINITIONS
All indexes are unmanaged and cannot be invested into directly.
The Russell 2000 Index measures the performance of the small cap segment of the U.S. equity universe. The Russell 2000 Index is a subset of the Russell 3000 Index representing approximately 10% of the total market capitalization of that index.
The S&P 500 Index is a capitalization-weighted index of 500 stocks designed to measure performance of the broad domestic economy through changes in the aggregate market value of 500 stocks representing all major industries.
This research material has been prepared by LPL Financial.
To the extent you are receiving investment advice from a separately registered independent investment advisor, please note that LPL Financial is not an affiliate of and makes no representation with respect to such entity.
Not FDIC or NCUA/NCUSIF Insured | No Bank or Credit Union Guarantee | May Lose Value | Not Guaranteed by Any Government Agency | Not a Bank/Credit Union Deposit
Tracking #1-489811 (Exp. 04/17)