Heightened Risk Aversion Weighs on Risk Assets
Click here to download a PDF of this report.
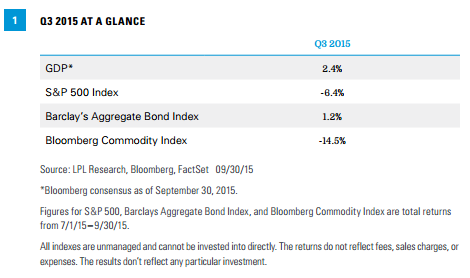
- The U.S. economy has been holding steady, despite international concerns. Based on data received so far, third quarter gross domestic product (GDP) growth is tracking at 2.0–2.5%, following upwardly revised 3.9% growth in the second quarter as the economy rebounded from temporary factors restraining growth early in the year. Labor markets continue to heal, but manufacturing expansion has slowed due to low oil prices and a strong dollar. Slowing growth in emerging markets, particularly China, is only having a modest impact on the U.S. economy but has roiled financial markets. International uncertainty has led to a more cautious Federal Reserve (Fed), and rate hikes may be delayed into early 2016.
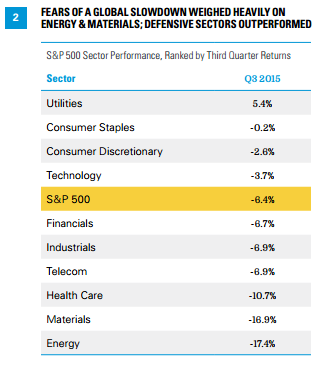
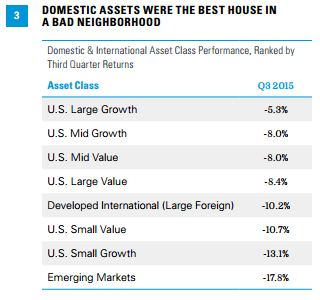
- Stocks fall, breaking streak of 10 quarterly gains. The S&P 500 failed to produce a positive quarter for the first time since 2011, posting a negative total return of -6.4%. The quarter began on a positive note as second quarter earnings showed profit growth in the non-energy sectors of the economy, particularly financials and retail. However, August proved to be a particularly rough month as investor sentiment was damaged by concerns for a weakening Chinese economy, a slump in oil and metals prices, and uncertainty around the timing of a Fed rate hike. The quarter’s losses eliminated the gains for the year, Please note: All return figures are as bringing the S&P 500’s total return to -5.3% year to date.
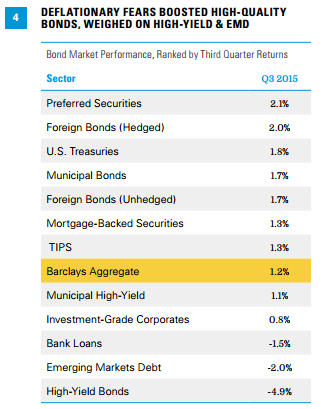
- Bonds have strong quarter as risk-off sentiment prevails. After a difficult second quarter, the third quarter of 2015 was a strong one for most sectors of the fixed income market. The Barclays U.S. Aggregate returned 1.2% during the quarter, bringing the year-to-date return back into positive territory at 1.1%. Risk-off sentiment, stirred mainly by China’s stock market and slowing growth and knock-on global growth concerns, led to lower interest rates across the maturity spectrum and a flattening of the yield curve. Against this flattening backdrop, longer-dated fixed income outperformed shorter-dated. More economically sensitive sectors, such as highyield, were hurt by global growth concerns and underperformed the broad fixed income market
- Oil’s bounce proved temporary as second quarter gains were given back. The Bloomberg Commodity Index was heavily influenced by oil’s decline and returned -14.5% for the quarter. Oil’s gains in the second quarter were lost entirely in the third quarter as concerns continued to mount over OPEC’s persistence of supply and how far U.S. production will fall. The U.S. dollar was up, but marginally so. Grains lost ground as worries about the quality of upcoming harvests abated due to continually stronger than expected crop reports. Precious metals fell and failed to gain traction, even with concerns over China’s growth.
- Defensively positioned equity market neutral strategies lead gains. In a quarter marked by increasing levels of volatility, low-beta equity market neutral managers delivered strong quarterly returns of 3.67% (as measured by the HFRX Equity Market Neutral Index), while more directionally sensitive long/short equity and event driven managers saw steep losses. After a significant sell-off in the second quarter caused by several long-term trend reversals, managed futures also provided moderate gains due to long fixed income exposure, as well as short commodity positioning.
A Look Forward
We expect the U.S. economy will expand at a rate of 3% or higher in the second half of 2015,* led by both consumer and business spending. Continued economic growth and operating discipline should continue to benefit earnings growth in sectors beyond energy. However, the sluggish pace of overall earnings growth in the second half of 2015 may make reaching mid-single-digit stock market returns for 2015 difficult. After a strong third quarter, bonds offer limited additional upside for the remainder of 2015.
Asset class returns are represented by the returns of indexes and are not ranked on an annual total return basis. It is not possible to invest directly in an index so these are not actual results an investor would achieve.
Bond Market Asset Class Indexes: Foreign Bonds (hedged) – Citigroup Non-U.S. World Government Bond Index Hedged for Currency; Preferred Securities – Merrill Lynch Preferred Stock Hybrid Securities Index; Treasury – Barclays U.S. Treasury Index; Mortgage-Backed Securities – Barclays U.S. MBS Index; Investment-Grade Corporate – Barclays U.S. Corporate Bond Index; Municipal – Barclays Municipal Bond Index; Municipal High-Yield – Barclays Municipal High Yield Index; TIPS – Barclays Treasury Inflation-Protected Securities Index; Bank Loans – Barclays U.S. High Yield Loan Index; High-Yield – Barclays U.S. Corporate High Yield Index; Emerging Market Debt – JP Morgan Emerging Markets Global Index; Foreign Bonds (unhedged) – Citigroup Non-U.S. World Government Bond Index (unhedged)
Sources: LPL Research, FactSet 09/30/15
All indexes are unmanaged and cannot be invested into directly. The returns do not reflect fees, sales charges, or expenses. The results don’t reflect any particular investment. Past performance is no guarantee of future results.
Because of its narrow focus, sector investing will be subject to greater volatility than investing more broadly across many sectors and companies.
The sectors are represented by the 10 S&P 500 Global Industry Classification Standard (GICS) indexes.
Asset classes based on Russell 1000, Russell 3000 Growth and Value Indexes, Russell 2000, Russell Midcap Index, MSCI EAFE, MSCI Emerging Markets Index.
IMPORTANT DISCLOSURES
The opinions voiced in this material are for general information only and are not intended to provide specific advice or recommendations for any individual. To determine which investment(s) may be appropriate for you, consult your financial advisor prior to investing. All performance reference is historical and is no guarantee of future results. All indexes are unmanaged and cannot be invested into directly.
General Stock & Debt Equity Risks
Stock investing may involve risk including loss of principal.
Investing in foreign and emerging markets securities involves special additional risks. These risks include, but are not limited to, currency risk, geopolitical risk, and risk associated with varying accounting standards. Investing in emerging markets may accentuate these risks.
There is no guarantee that a diversified portfolio will enhance overall returns or outperform a nondiversified portfolio. Diversification does not ensure against market risk.
Government bonds and Treasury bills are guaranteed by the U.S. government as to the timely payment of principal and interest and, if held to maturity, offer a fixed rate of return and fixed principal value. However, the value of fund shares is not guaranteed and will fluctuate.
High-yield/junk bonds are not investment-grade securities, involve substantial risks, and generally should be part of the diversified portfolio of sophisticated investors.
Event driven strategies, such as merger arbitrage, consist of buying shares of the target company in a proposed merger and fully or partially hedging the exposure to the acquirer by shorting the stock of the acquiring company or other means. This strategy involves significant risk as events may not occur as planned and disruptions to a planned merger may result in significant loss to a hedged position.
Managed futures funds use systematic quantitative programs to find and invest in positive and negative trends in the futures markets for financials and commodities. Historically, the benefit of managed futures have been solid long-term returns with very low correlation to equities and fixed income securities.
Long/short equity funds are subject to normal alternative investment risks, including potentially higher fees; while there is additional management risk, as the manager is attempting to accurately anticipate the likely movement of both their long and short holdings. There is also the risk of “beta-mismatch,” in which long positions could lose more than short positions during falling markets.
Definitions
An organization consisting of the world’s major oil-exporting nations. The Organization of Petroleum Exporting Countries (OPEC) was founded in 1960 to coordinate the petroleum policies of its members, and to provide member states with technical and economic aid. OPEC is a cartel that aims to manage the supply of oil in an effort to set the price of oil on the world market, in order to avoid fluctuations that might affect the economies of both producing and purchasing countries.
Beta measures a portfolio’s volatility relative to its benchmark. A beta greater than one suggests the portfolio has historically been more volatile than its benchmark. A beta less than one suggests the portfolio has historically been less volatile than its benchmark.
Gross domestic product (GDP) is the monetary value of all the finished goods and services produced within a country’s borders in a specific time period, though GDP is usually calculated on an annual basis. It includes all of private and public consumption, government outlays, investments, and exports less imports that occur within a
defined territory.
Risk-on risk-off refers to changes in investment activity in response to global economic patterns. During periods when risk is perceived as low, risk-on risk-off theory states that investors tend to engage in higher-risk investments. When risk is perceived as high, investors have the tendency to gravitate toward lower-risk investments.
Index Definitions
The Barclays U.S. Corporate High Yield Index measures the market of USD-denominated, noninvestment grade, fixed-rate, taxable corporate bonds. Securities are classified as high yield if the middle rating of Moody’s, Fitch, and S&P is Ba1/BB+/BB+ or below, excluding emerging markets debt.
The Barclays U.S. High Yield Loan Index tracks the market for dollar-denominated floating-rate leveraged loans. Instead of individual securities, the U.S. High-Yield Loan Index is composed of loan tranches that may contain multiple contracts at the borrower level.
The Barclays U.S. Aggregate Bond Index is a broad-based flagship benchmark that measures the investment-grade, U.S. dollar-denominated, fixed-rate taxable bond market. The index includes Treasuries, government-related and corporate securities, MBS (agency fixed-rate and hybrid ARM pass-throughs), ABS, and CMBS (agency and non-agency).
The Barclays U.S. Corporate Index is a broad-based benchmark that measures the investment-grade, U.S. dollar-denominated, fixed-rate, taxable corporate bond market.
The Barclays U.S. Treasury Index is an unmanaged index of public debt obligations of the U.S. Treasury with a remaining maturity of one year or more. The index does not include T-bills (due to the maturity constraint), zero coupon bonds (strips), or Treasury Inflation-Protected Securities (TIPS).
The Barclays U.S. Mortgage Backed Securities (MBS) Index tracks agency mortgage backed pass-through securities (both fixed rate and hybrid ARM) guaranteed by Ginnie Mae (GNMA), Fannie Mae (FNMA), and Freddie Mac (FHLMC).
The Barclays U.S. Treasury TIPS Index is a rules-based, market value-weighted index that tracks inflation-protected securities issued by the U.S. Treasury.
The BofA Merrill Lynch Preferred Stock Hybrid Securities Index is an unmanaged index consisting of a set of investment-grade, exchange-traded preferred stocks with outstanding market values of at least $50 million that are covered by Merrill Lynch Fixed Income Research.
The Bloomberg Commodity Index is calculated on an excess return basis and composed of futures contracts on 22 physical commodities. It reflects the return of underlying commodity futures price movements.
The HFRX Equity Market Neutral Index strategies employ sophisticated quantitative techniques of analyzing price data to ascertain information about future price movement and relationships between securities, select securities for purchase and sale. These can include both factor-based and statistical arbitrage/trading strategies. Factor-based investment strategies include strategies in which the investment thesis is predicated on the systematic analysis of common relationships between securities. In many but not all cases, portfolios are constructed to be neutral to one or multiple variables, such as broader equity markets in dollar or beta terms, and leverage is frequently employed to enhance the return profile of the positions identified. Statistical arbitrage/trading strategies consist of strategies in which the investment thesis is predicated on exploiting pricing anomalies that may occur as a function of expected mean reversion inherent in security prices; high frequency techniques may be employed and trading strategies may also be employed on the basis on technical analysis or opportunistically to exploit new information the investment manager believes has not been fully, completely, or accurately discounted into current security prices. Equity market neutral strategies typically maintain characteristic net equity market exposure no greater than 10% long or short.
The JP Morgan Emerging Markets Bond Index is a benchmark index for measuring the total return performance of international government bonds issued by emerging markets countries that are considered sovereign (issued in something other than local currency) and that meet specific liquidity and structural requirements.
The Russell 1000 Index measures the performance of the large-cap segment of the U.S. equity universe. It is a subset of the Russell 3000 Index and includes approximately 1000 of the largest securities based on a combination of their market cap and current index membership. The Russell 1000 represents approximately 92% of the U.S. market.
The Russell Midcap Index offers investors access to the mid cap segment of the U.S. equity universe. The Russell Midcap Index is constructed to provide a comprehensive and unbiased barometer for the mid cap segment and is completely reconstituted annually to ensure that larger stocks do not distort the performance and characteristics of the true mid cap opportunity set. The Russell Midcap Index includes the smallest 800 securities in the Russell 1000.
The Russell 2000 Index measures the performance of the small cap segment of the U.S. equity universe. The Russell 2000 Index is a subset of the Russell 3000 Index representing approximately 10% of the total market capitalization of that index.
The Russell 3000 Growth Index measures the performance of the broad growth segment of the U.S. equity universe. It includes those Russell 3000 companies with higher price-to-book ratios and higher forecasted growth values.
The Russell 3000 Value Index measures the performance of the broad value segment of U.S. equity value universe. It includes those Russell 3000 companies with lower price-to-book ratios and lower forecasted growth values.
The MSCI EAFE Index is recognized as the pre-eminent benchmark in the United States to measure international equity performance. It comprises the MSCI country indexes that represent developed markets outside of North America: Europe, Australasia, and the Far East.
The MSCI Emerging Markets Index captures large and mid cap representation across 23 emerging markets (EM) countries. With 822 constituents, the index covers approximately 85% of the free float-adjusted market capitalization in each country.
The S&P 500 Index is a capitalization-weighted index of 500 stocks designed to measure performance of the broad domestic economy through changes in the aggregate market value of 500 stocks representing all major industries.
The Barlcays U.S. Municipal Index covers the USD-denominated, long-term, tax-exempt bond market. The index has four main sectors: state and local general obligation bonds, revenue bonds, insured bonds, and prerefunded bonds.
The Barclays Municipal High Yield Bond Index is comprised of bonds with maturities greater than one-year, having a par value of at least $3 million issued as part of a transaction size greater than $20 million, and rated no higher than ‘BB+’ or equivalent by any of the three principal rating agencies.
The Citigroup Non-U.S. World Government Bond Hedged Index measures the performance of fixed-rate, local currency, investment grade sovereign bonds. This index is a widely used benchmark that currently comprises sovereign debt from over 20 countries, denominated in a variety of currencies, and has more than 25 years of history available. It provides a broad benchmark for the global sovereign fixed income market, excluding the U.S., with currencies hedged against the U.S. dollar
This research material has been prepared by LPL Financial.
To the extent you are receiving investment advice from a separately registered independent investment advisor, please note that LPL Financial is not an affiliate of and makes no representation with respect to such entity.
Not FDIC or NCUA/NCUSIF Insured | No Bank or Credit Union Guarantee | May Lose Value | Not Guaranteed by Any Government Agency | Not a Bank/Credit Union Deposit
Tracking #1-428478 (Exp. 02/16)