
KEY TAKEAWAYS
- It was a lackluster 2015 for a stock market that faced many challenges. As we turn the page to 2016 we look forward to a potentially better year for stocks.
- We look at some of the likely drivers of stocks in early 2016, including fourth quarter 2015 earnings season, holiday shopping results, the Fed, oil, and the political calendar.
Click here to download a PDF of this report.
TURNING THE PAGE
It was a lackluster 2015 for the stock market with the S&P 500 managing a total return of just 1.4% (dividends included). Equity investors struggled to predict the timing of the first Federal Reserve (Fed) rate hike in nearly a decade, a slowing Chinese economy weighed on emerging markets (EM), commodities prices–notably oil–plummeted, a booming U.S. dollar pressured earnings (and contributed to commodities weakness), and terror threat escalated.
Against that difficult backdrop for stocks, we got some things right and some things wrong.
WHAT WE GOT RIGHT
We were correct in our forecast for the Fed to begin its rate hike campaign in December 2015, which we maintained throughout the year, even as many had targeted mid-2015 earlier in the year and mid-2016 later in the year.
Although we were slightly optimistic in our stock market forecast, we did get the leadership correct, favoring growth over value and predicting a transition during the year to large cap leadership. The Russell 3000 Growth Index outgained its value counterpart by 9.2%, while large caps outperformed small by 5.3%, based on the Russell indexes.
At the sector level, most of our calls also added value, including favoring technology, consumer discretionary, and healthcare, and avoiding utilities.
WHAT WE MISSED
We were slightly overly optimistic on the stock market performance, as the S&P 500 missed the low end of our 5-9% total return target. However, we did not capitulate when stocks were down 10% on the year in late August 2015, and maintained our positive stock market view.
Our 2015 earnings forecast proved too optimistic because of tumbling oil prices and the strong U.S. dollar. If we exclude the energy and currency drags, corporate America actually produced high-single-digit earnings growth. We did not foresee the extent and duration of the energy downturn and its ripple effects, although our energy sector view was appropriately cautious throughout the majority of the year.
One victim of 2015 commodity weakness was the industrials sector, where our positive view missed the mark. We underestimated consumer staples’ boost from cheaper oil, as this sector solidly outperformed. We chose to play cheap oil through the consumer discretionary sector, which outperformed–and more so than consumer staples.
HIT AND MISS
We came into 2015 expressing a view that an opportunity would emerge in international equities. That opportunity never really emerged. We did maintain previously established, modest exposure to emerging markets during the year, which hurt performance, but largely avoiding international developed markets turned out to be the right asset allocation decision.
KEY FIRST QUARTER EVENTS
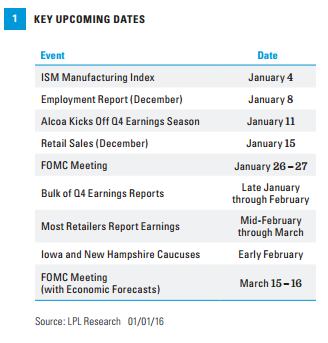
With the books closed on 2015, let’s now look ahead to some of the likely key drivers of stocks in early 2016:
Fourth quarter 2015 earnings season. After the important Institute for Supply Management (ISM) Manufacturing Index and employment reports for December 2015, due out this week (January 4-8), the next big event on investors’ calendars should be the start of fourth quarter earnings season, which unofficially begins with Alcoa’s quarterly results on January 11 and kicks into high gear at the end of the month. Thomson-tracked consensus expects a 3.7% year-over-year drop in S&P 500 earnings in the fourth quarter, which would end up as the third consecutive quarter of 1% earnings growth or less. Guidance from corporate America for 2016–beyond the commodity sectors–will be key to determining how stocks start the year. We will preview earnings season in next week’s commentary.
Holiday shopping results. Holiday shopping totals are not yet final but the numbers so far are quite good. According to MasterCard’s Spending Pulse, retail sales during the holiday season rose 7.9% year over year excluding autos and gasoline sales. E-commerce drove the strength with a reported 20% gain. The most complete picture of holiday shopping will come from the government’s official statistics for December (due out January 15, 2016), while results from the retailers themselves, mostly out in February, including gift card sales, will go further in determining how the stocks perform.
More Fed watching. Just when you thought it was safe to turn attention away from the Fed after the December 2015 rate hike, Fed speculation will ramp up again over the next couple of weeks with another Federal Open Market Committee (FOMC) meeting on tap for the last week of January 2016. One of the biggest stories of 2016 will be how the gap between what the Fed projects for the federal funds rate (four hikes of 0.25% each) and what the market expects (about half that) is resolved. After the January 2015 meeting, the FOMC meets again on March 15-16, 2016, and will update its economic forecasts. Our view is that the Fed hikes rates by 0.75% during the year.
And more oil watching. No specific energy event is on the first quarter 2016 calendar besides regular inventory, production, and rig count data (which certainly matter). The timing of geopolitically driven spikes in oil prices is unpredictable. But we put energy on this list because it is one of the biggest keys for markets in 2016 and will be watched every day. Beyond the impact on the energy sector, oil impacts capital spending (discussed in this week’s Weekly Economic Commentary), the industrials sector, overall S&P 500 profits, emerging markets, and the high-yield bond market. The next regularly scheduled Organization of Petroleum Exporting Countries (OPEC) meeting is not until June 2, 2016.
Political calendar. The presidential election year has historically not been beneficial for stocks until a likely winner emerges during the fourth quarter and removes the uncertainty. But when the Republican candidate emerges (with Hillary Clinton the presumptive Democratic nominee)–a process that will begin to take shape in Iowa and New Hampshire in February–the most politically sensitive stocks (healthcare, energy, and financial services) may move based on the candidates’ policies. The fact that 2016 is an election year does not mean much for stocks based on history (average S&P 500 gain in an election year at 7% is near the average for all years since World War II).
REAFFIRMING 2016 FORECAST
We continue to expect mid-single-digit returns for the S&P 500 in 2016,* consistent with historical mid-to-late economic cycle performance, driven by mid- to high-single-digit earnings and a largely stable price-to-earnings ratio (PE). With the S&P 500 ending 2015 at 2043, this forecast would put the index at around 2100 at the end of 2016 based on a 3% price gain and 2% dividend yield. Although this level represents a positive year for stocks and could potentially outgain the high-quality bond market, this forecast is among the more moderate on Wall Street. We expect these near historical routine returns as earnings start to normalize and oil markets find their equilibrium. But as we are still in the second half of the economic cycle, we will actively monitor pockets of volatility and potential signs of an economic downturn.
CONCLUSION
It was a lackluster 2015 for a stock market that faced many challenges. As we turn the page to 2016 we look forward to a better year for stocks. Early in 2016 we will be closely watching holiday shopping figures, earnings season, the Fed, oil, and the political calendar, to determine the market’s near-term direction.
*Historically since WWII, the average annual gain on stocks has been 7-9%. Thus, our forecast is roughly in-line with average stock market growth. We forecast a mid-single-digit gain, including dividends, for U.S. stocks in 2016 as measured by the S&P 500. This gain is derived from earnings per share (EPS) for S&P 500 companies assuming mid- to high-single-digit earnings gains, and a largely stable price-to-earnings ratio (PE). Earnings gains are supported by our expectation of improved global economic growth and stable profit margins in 2016.
IMPORTANT DISCLOSURES
The opinions voiced in this material are for general information only and are not intended to provide specific advice or recommendations for any individual. To determine which investment(s) may be appropriate for you, consult your financial advisor prior to investing. All performance referenced is historical and is no guarantee of future results.
The economic forecasts set forth in the presentation may not develop as predicted and there can be no guarantee that strategies promoted will be successful.
Bonds are subject to market and interest rate risk if sold prior to maturity. Bond values and yields will decline as interest rates rise, and bonds are subject to availability and change in price.
Investing in stock includes numerous specific risks including: the fluctuation of dividend, loss of principal, and potential liquidity of the investment in a falling market.
International and emerging markets investing involves special risks, such as currency fluctuation and political instability, and may not be suitable for all investors.
All investing involves risk including loss of principal.
Commodity-linked investments may be more volatile and less liquid than the underlying instruments or measures, and their value may be affected by the performance of the overall commodities baskets, as well as weather, geopolitical events, and regulatory developments.
Because of its narrow focus, investing in a single sector, such as energy or manufacturing, will be subject to greater volatility than investing more broadly across many sectors and companies.
DEFINITIONS
The PE ratio (price-to-earnings ratio) is a measure of the price paid for a share relative to the annual net income or profit earned by the firm per share. It is a financial ratio used for valuation: a higher PE ratio means that investors are paying more for each unit of net income, so the stock is more expensive compared to one with lower PE ratio.
INDEX DESCRIPTIONS
The Standard & Poor’s 500 Index is a capitalization-weighted index of 500 stocks designed to measure performance of the broad domestic economy through changes in the aggregate market value of 500 stocks representing all major industries.
The Russell 3000 Growth Index measures the performance of the broad growth segment of the U.S. equity universe. It includes those Russell 3000 companies with higher price-to-book ratios and higher forecasted growth values.
The Russell 3000 Value Index measures the performance of the broad value segment of U.S. equity value universe. It includes those Russell 3000 companies with lower price-to-book ratios and lower forecasted growth values.
The Institute for Supply Management (ISM) Index is based on surveys of more than 300 manufacturing firms by the Institute of Supply Management. The ISM Manufacturing Index monitors employment, production inventories, new orders, and supplier deliveries. A composite diffusion index is created that monitors conditions in national manufacturing based on the data from these surveys.
This research material has been prepared by LPL Financial LLC.
To the extent you are receiving investment advice from a separately registered independent investment advisor, please note that LPL Financial LLC is not an affiliate of and makes no representation with respect to such entity.
Not FDIC or NCUA/NCUSIF Insured | No Bank or Credit Union Guarantee | May Lose Value | Not Guaranteed by Any Government Agency | Not a Bank/Credit Union Deposit
Tracking #1-452925 (Exp. 01/17)