
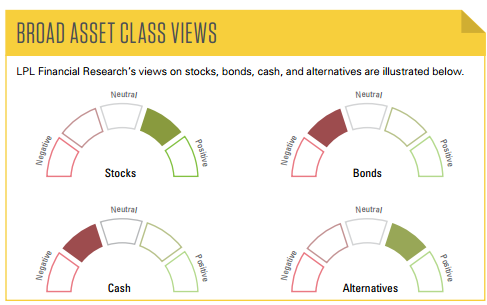
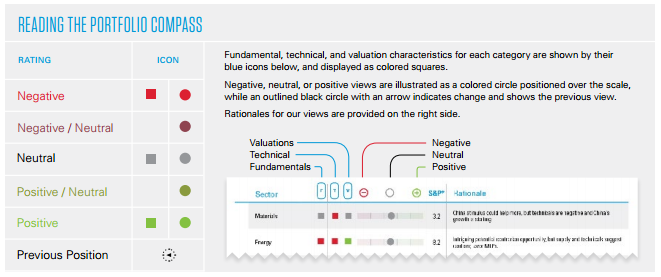
The Portfolio Compass provides a snapshot of LPL Financial Research’s views on equity, equity sectors, fixed income, and alternative asset classes. This biweekly publication illustrates our current views and will change as needed over a 3- to 12-month time horizon.
The top down is an important part of our asset allocation process. As a result, we have a new macro section including our views of the global economy and key drivers of those views, and a section on what we are watching that might change those views.
Click here to download a PDF of this report.
NAVIGATING THE MARKETS
COMPASS CHANGES
- Downgraded emerging market (EM) equities to neutral from neutral/positive.
INVESTMENT TAKEAWAYS
- We expect mid-single-digit returns for stocks in 2016,* as discussed in Outlook 2016: Embrace the Routine, led by large caps, cyclical growth, and healthcare.
- Better economic growth, more stimulus, and attractive valuations may lead international markets to outperform the U.S. in 2016. Technical weakness suggests caution toward EM may be warranted in the short term.
- A low-return fixed income environment is likely to persist. We emphasize a blend of high-quality intermediate bonds and less interest rate–sensitive sectors such as high-yield and bank loans for suitable investors.
- High-yield bonds represent value with an average yield spread in excess of 7%, but a lack of liquidity through year-end may cause volatility to persist. In general, we find default expectations among energy companies—and the overall high-yield market—too pessimistic.
- From a technical perspective, the S&P 500 price, if sustained above its 200-day simple moving average, increases the likelihood for a long-term bullish trend.
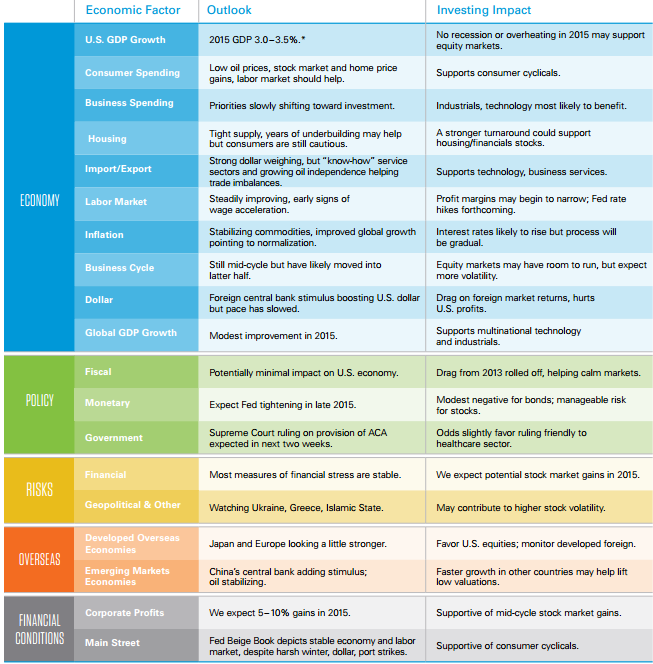
MACROECONOMIC VIEWS
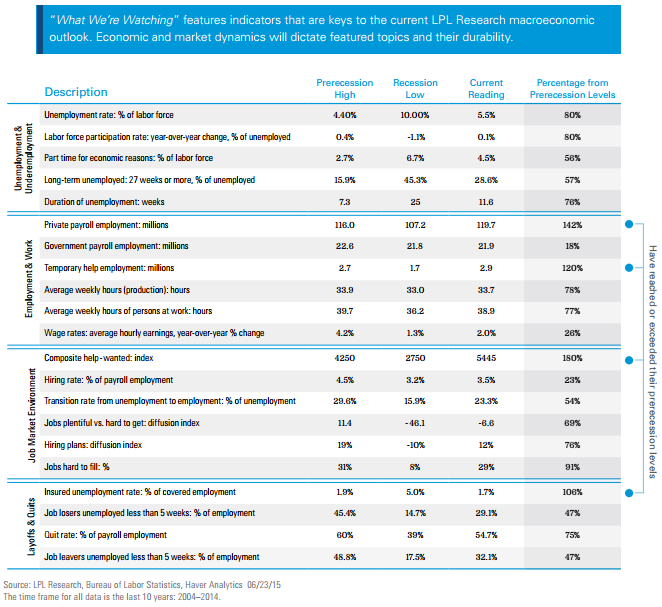
WHAT WE’RE WATCHING
As we highlighted in our Outlook 2015: In Transit, the Fed is watching a number of labor market indicators to help determine an appropriate timetable for interest rate hikes. We expect the Fed to begin its rate hike campaign in late 2015, but the pace of hikes will likely be gradual and reflect the progress in the various labor indicators listed here. Fed Chair Yellen’s labor market indicators are making progress, but have not yet reached full health, providing support for continued monetary policy support from the Fed.
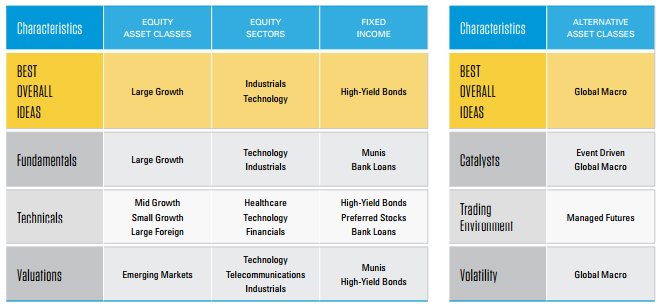
ASSET CLASS & SECTOR TOP PICKS
Below we provide our top overall ideas across the various asset classes and sectors covered in this publication, as well as our best ideas within the three disciplines of our investment process: fundamentals, technicals, and valuations. More details on these and other investment ideas can be found in subsequent pages.
EQUITY ASSET CLASSES
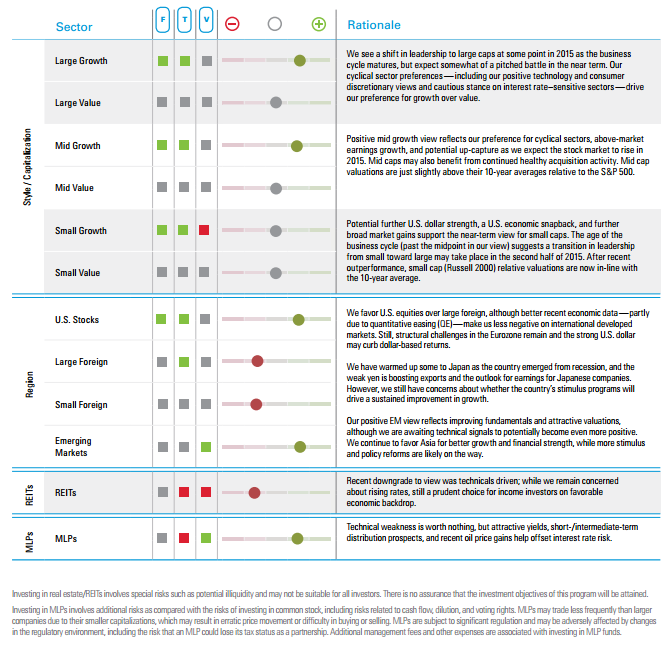
We forecast high-single-digit S&P 500 returns for 2015, driven by mid-single-digit earnings growth and little, if any, PE ratio expansion, as discussed in our Midyear Outlook 2015 publication. We favor U.S. equities and emerging markets over developed foreign, but our developed foreign view has become more positive on improved economic data and earnings growth. We expect a market leadership transition to large caps to occur at some point in the second half of 2015. Our sector preferences continue to support growth over value. We find MLPs attractive, particularly for income-oriented investors, for their yields and potential to benefit from higher oil prices.
EQUITY SECTORS
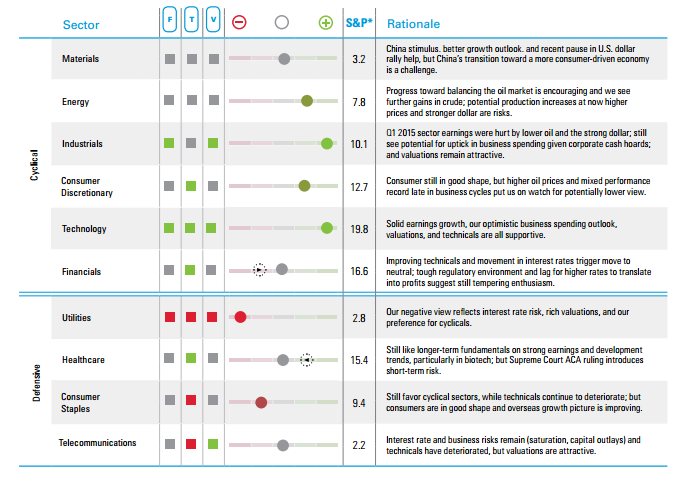
We continue to favor cyclical growth sectors, which tend to do well during the middle to late stages of the business cycle, with a focus on industrials and technology. Our modestly positive energy sector view reflects recent progress toward balancing supply and demand in the U.S., which we expect to support higher oil prices. The Supreme Court’s Affordable Care Act (ACA) ruling introduces short-term risk for healthcare, where we maintain a positive intermediate- to longer-term view.
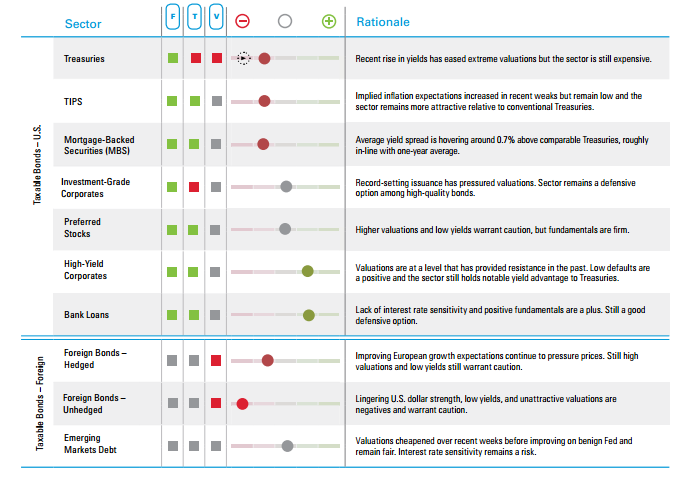
FIXED INCOME
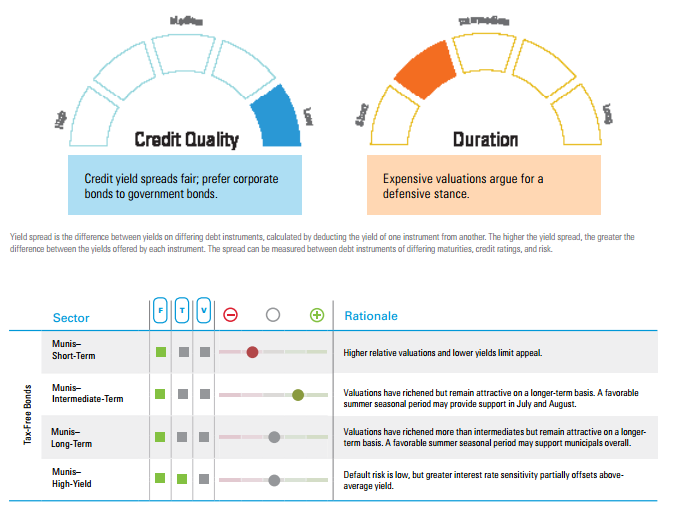
We prefer corporate bonds over higher-quality government bonds due to their relatively higher yields and the financial health of corporate America. Although yields increased in May, yields remain low and and valuations expensive, which argues for a defensive stance on fixed income by maintaining a lower than average portfolio interest rate sensitivity.
FIXED INCOME (CONTINUED)
Optimism over a Greek resolution, a benign Fed meeting, and modest improvement in second quarter economic data continue to pressure bond prices. Despite the rise in yields, valuations remain expensive by historical comparison and augur for low future returns for high-quality bonds. For fixed income allocations, we emphasize a blend of high-quality intermediate bonds coupled with less interest rate–sensitive sectors such as high-yield bonds and bank loans.
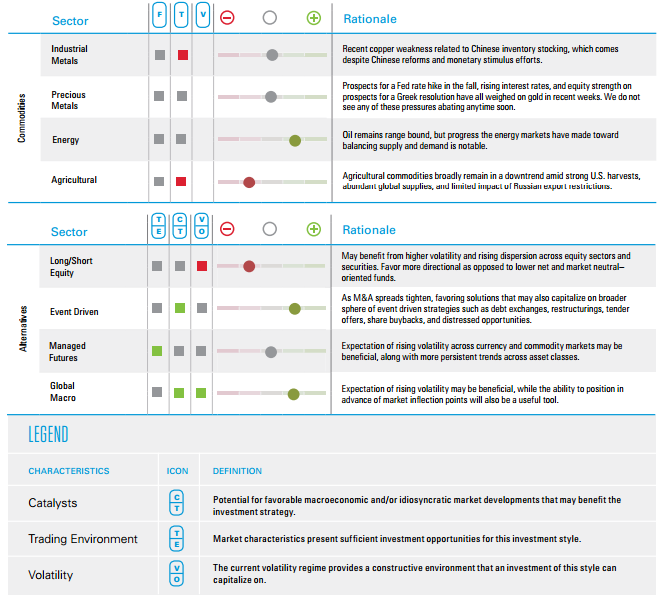
COMMODITIES & ALTERNATIVE ASSET CLASSES
Technical weakness and U.S. dollar strength keep us cautious on commodities broadly, although we see more potential upside to oil prices as supply and demand get better aligned in the months ahead. The risk now is that higher prices may attract more production. Divergent central bank policy may lead to higher market volatility and more asset dispersion, creating a more fertile environment for macro strategies. Since narrowly led equity markets have proven difficult for equity-oriented alternative strategies, we favor higher beta options there until individual stock selection is better rewarded.
IMPORTANT DISCLOSURES
All performance referenced is historical and is no guarantee of future results.
There is no assurance that the techniques and strategies discussed are suitable for all investors or will yield positive outcomes. The purchase of certain securities may be required to affect some of the strategies.
Stock and Pooled Investment Risks
Investing in stock includes numerous specific risks including: the fluctuation of dividend, loss of principal and potential illiquidity of the investment in a falling market. Investing in foreign and emerging markets securities involves special additional risks. These risks include, but are not limited to, currency risk, geopolitical risk, and risk associated with varying accounting standards. Investing in emerging markets may accentuate these risks.
Bond and Debt Equity Risks
Bonds are subject to market and interest rate risk if sold prior to maturity. Bond and bond mutual fund values and yields will decline as interest rates rise and bonds are subject to availability and change in price.
Government bonds and Treasury bills are guaranteed by the U.S. government as to the timely payment of principal and interest and, if held to maturity, offer a fixed rate of return and fixed principal value. However, the value of fund shares is not guaranteed and will fluctuate.
Alternative Risks
Currency risk is a form of risk that arises from the change in price of one currency against another. Whenever investors or companies have assets or business operations across national borders, they face currency risk if their positions are not hedged.
Long/short equity strategies are subject to normal alternative investment risks, including potentially higher fees; while there is additional management risk, as the manager is attempting to accurately anticipate the likely movement of both their long and short holdings. There is also the risk of “beta-mismatch,” in which long positions could lose more than short positions during falling markets.
Event driven strategies, such as merger arbitrage, consist of buying shares of the target company in a proposed merger and fully or partially hedging the exposure to the acquirer by shorting the stock of the acquiring company or other means. This strategy involves significant risk as events may not occur as planned and disruptions to a planned merger may result in significant loss to a hedged position.
Managed futures strategies use systematic quantitative programs to find and invest in positive and negative trends in the futures markets for financials and commodities. Futures and forward trading is speculative, includes a high degree of risk that the anticipated market outcome may not occur, and may not be suitable for all investors.
DEFINITIONS
The Simple Moving Average is an arithmetic moving average that is calculated by adding the closing price of the security for a number of time periods and then dividing this total by the number of time periods. Short-term averages respond quickly to changes in the price of the underlying, while long-term averages are slow to react.
Up-capture is a statistical measure of an investment manager’s overall performance in up-markets. The up-market capture ratio is used to evaluate how well an investment manager performed relative to an index during periods when that index has risen.
The PE ratio (price-to-earnings ratio) is a measure of the price paid for a share relative to the annual net income or profit earned by the firm per share. It is a financial ratio used for valuation: a higher PE ratio means that investors are paying more for each unit of net income, so the stock is more expensive compared to one with lower PE ratio.
Beta measures a portfolio’s volatility relative to its benchmark. A beta greater than one suggests the portfolio has historically been more volatile than its benchmark. A beta of less than one suggests the portfolio has historically been less volatile than its benchmark.
The Beige Book is a commonly used name for the Federal Reserve’s (Fed) report called the Summary of Commentary on Current Economic Conditions by Federal Reserve District. It is published just before the Federal Open Market Committee (FOMC) meeting on interest rates and is used to inform the members on changes in the economy since the last meeting.
Quantitative Easing (QE) refers to the Federal Reserve’s (Fed) current and/or past programs whereby the Fed purchases a set amount of Treasury and/or Mortgage-Backed securities each month from banks. This inserts more money in the economy (known as easing), which is intended to encourage economic growth.
INDEX DEFINITIONS
All indexes are unmanaged and cannot be invested into directly.
The Russell 2000 Index measures the performance of the small cap segment of the U.S. equity universe. The Russell 2000 Index is a subset of the Russell 3000 Index representing approximately 10% of the total market capitalization of that index.
The S&P 500 Index is a capitalization-weighted index of 500 stocks designed to measure performance of the broad domestic economy through changes in the aggregate market value of 500 stocks representing all major industries.
This research material has been prepared by LPL Financial.
To the extent you are receiving investment advice from a separately registered independent investment advisor, please note that LPL Financial is not an affiliate of and makes no representation with respect to such entity.
Not FDIC or NCUA/NCUSIF Insured | No Bank or Credit Union Guarantee | May Lose Value | Not Guaranteed by Any Government Agency | Not a Bank/Credit Union Deposit
Tracking #1-449287 (Exp. 12/16)